
Oil Slick Detection
The SAR signal is sensitive to the roughness of the sea surface, which is modulated by wind speed and direction; imagery acquired at VV polarization is the most sensitive to wind speed variability. The suppression of the capillary waves by oil from either anthropogenic sources, such as an oil spill, or from natural biological slicks, reduces the surface roughness resulting in less radar backscatter and darker image tones. The detection of oil slicks has been found to be best in moderate wind conditions in the range of 3 to 10 m/s. Oil spill images are available from both HH (Figure 9-53) and VV polarization systems (Figure 9-54); examples are provided below.
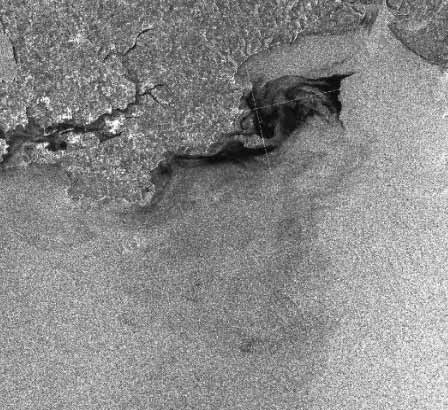
Figure 9-53. RADARSAT-1 C-HH image of an oil slick off the coast of Wales (United Kingdom), from February 1996. Source: CEOS 2000
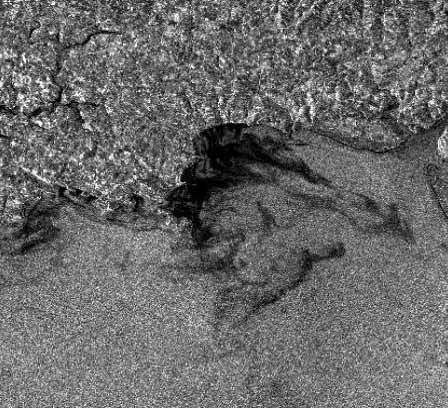
Figure 9-54. ERS-1 C_VV image of the same oil slick off the coast of Wales (United Kingdom) from February 1996. Source: CEOS 2000
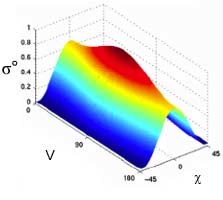
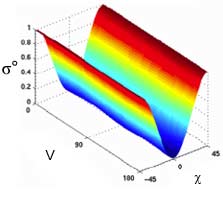
Although imagery in both VV and HH polarizations can be used for slick detection, the VVimagery is preferred as, in general, it offers a better signal to clutter ratio than other polarization choices (i.e., HH, VH, or HV). This is summarized in Table 9-3. Although VV is more sensitive than HH for slick detection, there may not be any advantage to using the co-polarized or cross-polarized signatures as oil-free and oil-covered surfaces tend to have similar contrast and polarization ratios (Figure 9-55) in these two cases. Slick thickness and the inability to differentiate oil slicks from "look-alikes" such as areas of low-wind, grease ice, or biological surfactants remain problematic.
| Polarization | Water | Oil-covered Water | SAR noise floor | Contrast |
|---|---|---|---|---|
| VV | -20 dB | -28 dB | -30 dB | 8 dB |
| HH | -24 dB | -32 dB | -30 dB | 6 dB |
| HV | -30 dB | -38 dB | -30 dB | 0 dB |
Table 9-3. Hypothetical radar backscatter values for water, oil-covered water, and the SAR noise floor illustrating the improved contrast at VV polarization for oil slick detection. (CCRS, Polarimetry Tutorial, IGARSS'02).
|
Co-pol Response |
Cross-pol Response |
|---|---|
|
Co-pol Response |
Cross-pol Response |
|
|
|
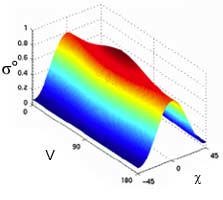
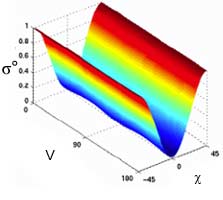
 = Normalized
  = Ellipticity Angle
Figure 9-55. C-band co-and cross-polarization signatures from SIR-C data acquired over an oil spill off the coast of Japan on April 16, 1994 showing little difference in slick-covered water (bottom) and open water (top), as suggested from polarization sensitivity analyses (CCRS, Polarimetry Tutorial, IGARSS'02).
Page details
- Date modified: