
Sectoral Impacts and Adaptive Capacity
How biophysical changes affect British Columbia's society depends on social and economic factors at both local and regional scales. The vulnerability of people and communities to climate change risks is a function of their physical exposure to natural hazards, their interdependencies with the natural environment (e.g. natural resources) and their adaptive capacity (Dolan and Walker, 2007; see also Chapter 2). Although the trend towards a more diversified economy improves the adaptive capacity of the BC economy as a whole to climate change and other stressors, it is unlikely that such diversification will be evenly distributed across all regions and sectors.
Climate change will impact economic development in BC, in ways that range from changes in domestic natural resources (e.g. forests, water and wilderness) to changes in the geography of optimal land-use activities (e.g. high-value agriculture crops, forage crops and commercial forestry) to increases in the social and economic costs associated with expected increases in extreme weather events.
The following sections examine how different economic sectors of BC are being impacted by changing climate, including, where possible, discussion of current and possible future adaptation initiatives.
3.1 WATER RESOURCE MANAGEMENT
Water resources, and their management and use, are highly sensitive to climate variability and change. Water managers will be challenged to meet multiple, often competing objectives (energy, irrigation, navigation, flood control, in-stream requirements) under conditions of changing supply and demand.
Surface Water
British Columbia has immense water resources, with approximately one-third of Canada's surface water. The implications of climate change for management of surface water resources have received considerable attention in the Columbia River basin (cf. Hamlet and Lettenmaier, 1999; Mote et al., 1999; Miles et al., 2000), including consideration of transborder issues (Cohen et al., 2000; Hamlet, 2003; Payne et al., 2004). As discussed above (Section 2.4), climate-induced changes in hydrology, including reduced snow pack and earlier snowmelt peaks, have significant implications for regional water supplies and fisheries. Increased flows during winter months and an earlier flood season will result in less water flowing during the summer months, when irrigation demand is highest. Reduced summer flows will also affect hydroelectricity generation and salmon habitat. It will be difficult to achieve current management objectives for both hydroelectric generation and in-stream flows to support fisheries under virtually all future climate scenarios (Payne et al., 2004). Within the Fraser River basin, a longer low-flow period could elevate summer stream temperatures by almost 2 °C, with serious implications for fisheries (Morrison et al., 2002; Loukas et al., 2004). Hydrological scenarios for the Okanagan valley and implications for fisheries are discussed in detail in Section 4.3.
Although some research is available on hydrological impacts in the Liard River and Peace River basins of northeastern BC (see Cohen, 1997), climate change has not been considered in current management plans. For example, although the Peace River Water Use Plan includes reduction of greenhouse gas emissions as a management goal, it does not discuss management options for the hydrological changes that will be associated with climate change (BC Hydro, 2004).
Groundwater
Approximately 600 000 people (22% of British Columbia's population) rely on groundwater as a source of drinking water (BC Ministry of Environment, Land and Parks, 1993). Agriculture and industry, including irrigation, pulp and paper, fish hatcheries, food processing, mining, chemical and petrochemical industries, parks and airports, are all major users of groundwater in the province (Liebscher, 1987). To date, more than 600 aquifers have been mapped and classified according to the BC Aquifer Classification System8.
In addition to the direct impact of climate change on groundwater tables and quality (see Section 2.4), increased demand for groundwater is anticipated in areas of the province where surface-water systems are unable to meet consumptive and in-stream demands. In some areas, such demands may necessitate deepening water supply wells to access deeper aquifers that are less sensitive to changing climate (Rivera et al., 2004).
3.2 FISHERIES
The fisheries and aquaculture sector, including commercial and sport fishing, aquaculture and seafood processing, employs about 20 000 people throughout British Columbia (BC Ministry of Agriculture and Lands, 2005a; Table 4). In 2004, BC seafood had annual raw-harvest and processed wholesale values of $620 million and $1.1 billion, respectively (BC Ministry of Agriculture and Lands, 2005a). Sport fishing, with important links to tourism (see Section 3.5), forms the largest single component, accounting for around 8900 jobs and contributing about $233 million per year to provincial GDP (BC Ministry of Agriculture and Lands, 2004). British Columbia aquaculture includes 700 site licenses for 30 species of fish, shellfish and marine plants. Aquaculture sales increased rapidly from $3 million in 1983 to more than $212 million in 2005 (BC Ministry of Agriculture and Lands, 2005a). Nevertheless, the fisheries sector accounted for less than 1% of provincial GDP in 2001 (BC Ministry of Labour and Citizens' Services, 2006).
| Sector | Sector revenue (millions of dollars) | Contribution to BC's gross domestic product (millions of dollars) | Contribution to BC's employment (thousands of jobs) |
|---|---|---|---|
| Commercial fisheries | 358 | 170 | 5.4 |
| Aquaculture | 287 | 116 | 1.9 |
| Seafood processing | 602 | 82 | 3.9 |
| Sport fishing | 675 | 233 | 8.9 |
| Sector total | 1922 | 601 | 20.1 |
Fisheries, and species such as Pacific salmon, are also keystone contributors (sensu Garibaldi and Turner, 2004) to the social, cultural, legal and ecological fabric of British Columbia (Pearse, 1982; Glavin, 1996). Sustainable fisheries, and the status and trends of wild salmon in particular, are viewed as vital indicators for maintenance of ecosystem integrity. Moreover, constitutional guarantees of access to fish to meet the food, cultural and societal needs of Aboriginal peoples make the maintenance and restoration of traditional fisheries key elements in treaty negotiations throughout BC (Raunet, 1984; Harris, 2001). Economic impacts on the fisheries sector therefore have important consequences for activities in other sectors (e.g. agriculture, forestry, mining, energy development and urban development).
During the past century, fisheries in British Columbia have changed in response to many factors (Box 2), including climate variability. The relationships between climate variability and the many physical variables affecting BC fish populations have been summarized for freshwater (Northcote, 1992) and marine environments (King, 2005; Fisheries and Oceans Canada, 2006a). These relationships make it clear that climate change will induce a wide range of responses from fish and fisheries in BC.
Sensitivity to climate variability and change varies greatly between short-lived species, such as shrimp, salmon, herring and sardines, and long-lived species, including geoduck clams, ocean perch and halibut (Fisheries and Oceans Canada, 2001). Short-lived species respond quickly to changes in climate, and populations can collapse or recover without warning, as evidenced by sardines (Hargreaves et al., 1994), herring (Schweigert, 1993) and salmon (McKinnell et al., 2001; Hyatt et al., 2003; Riddell, 2004; Fisheries and Oceans Canada, 2006b, c). Climate- or fishery-induced production trajectories of longer lived species change slowly, sometimes over a decade or longer, allowing greater predictability of fisheries yield, as in the case of halibut (Clarke and Hare, 2002). These differences between species will affect adaptation decisions.
BOX 2
Fisheries sector trends in British Columbia
Halibut, herring, sardines, hake and salmon have supported major fisheries in BC since the late 1800s (Fisheries and Oceans Canada, 2001). Salmon fisheries have been dominant from a socioeconomic perspective for much of the past century. Salmon catch reached historical highs in the 1980s, followed by extreme lows in the 1990s (Beamish and Noakes, 2004) due to changes in marine productivity (Hare and Mantua, 2000; Beamish et al., 2003), management agency objectives (e.g. protect biodiversity; Hyatt and Riddell, 2000; Irvine et al., 2005) and low prices for wild salmon due to increased competition from aquaculture (Noakes et al., 2002). Currently, wild-capture fisheries are stable (major groundfish species and most invertebrates) or decreasing (e.g. salmon), whereas aquaculture production is increasing (Fisheries and Oceans Canada, 2001). Despite changing conditions, the fisheries sector has maintained an average landed value of $550 million (range $380 –720 million) since 1985 (BC Ministry of Agriculture and Lands, 2002).
Fisheries responses to climate change will vary greatly among regions (Ware and McFarlane, 1989; Ware and Thomson, 2005). In freshwater ecosystems, climate change is already affecting the quantity (lake levels, river flow) and quality (temperature, nutrient levels) of seasonal to annual water supplies around Georgia basin (Whitfield et al., 2002b; Quilty et al., 2004), the Fraser River basin (Morrison et al., 2002) and the BC southern interior (see Sections 2.4 and 3.1), disrupting life histories and production of resident and migratory salmonids (Levy, 1992; MacDonald et al., 2000; Hyatt et al., 2003).
The Georgia Strait and the coastal upwelling zone west of Vancouver Island support some of the richest marine fisheries in BC (Ware and McFarlane, 1989). Studies of prehistoric (Wright et al., 2005) and historical intervals (Fisheries and Oceans Canada, 2006a) suggest that species dominance in these areas is highly variable, with salmon, herring and resident hake being most prevalent during cool conditions and migratory hake, along with such ‘exotic' species as mackerel, tuna and even Humboldt squid, infiltrating from the south during warm conditions (Fisheries and Oceans Canada, 2006a). Experience suggests that economic gains from harvest of larger quantities of migratory hake (Ware and McFarlane, 1995), sardine (McFarlane and Beamish, 1998) and tuna under a warmer regime will not immediately offset losses from collapses of higher value (Table 5) salmon fisheries (Hyatt et al., 2003; Fisheries and Oceans Canada, 2006a). In addition, established coldwater fisheries have mature infrastructure (catching and processing capacity, established markets and fisheries management systems) that is lacking in new fisheries for exotic species. Economic dislocation and social stress in fisheries-dependent communities are likely to increase as climate continues to change, with losses from traditional fisheries exceeding returns from efforts to develop new ones or to replace them with aquaculture operations. Outcomes like these stress small coastal communities in particular, given their high reliance on traditional fisheries (Ommer, 2006, 2007).
| Species group | Maximum age of fish (years) | Total weight (metric tons) | Average landed value1 (millions of dollars, 1985-2002) | Approximate value1 in 2002 (millions of dollars) |
|---|---|---|---|---|
| Rockfish | 58–205 | 15 236 | 10 | |
| Sablefish | 113 | 3 947 | 25 | 21 |
| Ocean perch | 100 | 6 179 | 5 | 6 |
| Pacific halibut | 55 | 6 096 | 30 | 43 |
| Pollock | 33 | 1,044 | 1 | |
| Lingcod | 25 | 1 984 | ||
| Pacific cod | 25 | 708 | 4 | 1 |
| Pacific hake | 23 | 22 347 | 12 | 12 |
| Pacific herring | 15 | 27 725 | 60 | 50 |
| Sardine | 13 | 800 | ||
| Tuna albacore | 10 | 233 | ||
| Chinook and coho salmon | 4–8 | 540 | 500 | 600 |
| Sockeye salmon | 7 | 8 670 | 100 | 40 |
| Chum salmon | 7 | 2 780 | 20 | 3 |
| Pink salmon | 3 | 7 160 | 20 | 5 |
| Total | $787 million | $781 million |
1Values identified here refer to landed value for all species except chinook and coho salmon, for which recreational fisheries in marine and tidal waters generate much higher revenues.
Climate impacts on fisheries in the area of the Queen Charlotte basin are less certain. The historical effects of warmer waters, altered production regimes (e.g. King, 2005; Ware and Thomson, 2005) and exotic species have not produced obvious declines of herring and salmon in this region. In fact, some evidence suggests increased production of these species during warmer intervals (Boldt et al., 2005).
Many BC salmon rear for 1 to 4 years in the offshore waters of the Gulf of Alaska, so climate change in that region will impact salmon distribution (e.g. displacement to the Bering Sea; Welch et al., 1998). Changes in thermal stratification, nutrient delivery, primary production (Behrenfeld et al., 2006) or even ocean acidification (Raven et al., 2005) could profoundly influence salmon and fisheries production throughout BC. The ultimate consequences of such complex changes are unknown, but likely place southern rather than northern fisheries at greater risk of future losses.
Adaptation
Three public enquiries in the past 15 years (Pearse and Larkin, 1992; Fraser River Sockeye Public Review Board, 1995; Williams, 2005) considered causes, consequences and solutions for precipitous declines in production and harvest levels for southern coho, steelhead and Fraser River sockeye salmon (Fisheries and Oceans Canada, 2006b). Economic losses to the commercial sockeye fishery alone were estimated at $72 million in 2002, and likely exceeded this in 2004 (Cooke et al., 2004). Each enquiry identified a complex set of factors driving the declining fishery, including climate-induced production losses and associated management uncertainties. Declines of salmon in the Fraser River and elsewhere have stimulated initiatives calling for agencies and society to safeguard the productive capacity of habitats for wild fish and fisheries, given rapid human population increases combined with climate change threats in BC (Pacific Fisheries Resource Conservation Council, 2006). Without adaptation, continued reductions or elimination of salmon could occur in extensive areas of the BC interior and Georgia basin, where cumulative human impacts (Slaney et al., 1996), plus climate-induced changes to flow and temperature conditions (Rosenau and Angelo, 2003), have created significant problems for maintenance of fish populations and habitat. Conflicts over meeting the requirements for fisheries habitat as well as the water needs of other sectors (e.g. mining, agriculture, energy, urban development) are certain to intensify in the future.
Awareness of climate-induced impacts on the fisheries sector, relative to non-climatic factors, varies greatly among recreational, commercial, First Nations and management agency groups. Multi-party discussions at recent colloquia suggest a growing awareness that fisheries are unlikely to return to a state of business-as-usual (Interis, 2005), and that a range of adaptive responses will be required to meet challenges posed by climate change. Specific adaptation measures that have been discussed include 1) reducing harvest rates to provide conservation buffers, given increasingly variable stock productivity (Mantua and Francis, 2004); 2) reinforcing habitat protection and restoration measures by all sectors to promote increased sustainability of capture fisheries; 3) increasing hatchery production of salmon to counter declining productive capacity of freshwater or marine habitat; 4) licensing and regulating river systems; or 5) promoting accelerated development of aquaculture to meet market demands for products that capture-fisheries cannot satisfy. Shifting harvest opportunities provided by short-lived versus long-lived species, or from established (e.g. salmon, herring) to relatively unexploited species (e.g. mackerel, squid) may require a different suite of adaptation measures. These might involve licensing processes that promote participation in multiple fisheries for a diversity of short- and long-lived species, and increased investment to speed the development of processing, marketing and management infrastructure for newly emergent fisheries.
3.3 FORESTRY
British Columbia's 62 million ha of forest provide a wide range of social, cultural, economic and biological values and services (Gagn é et al., 2004; Forest Products Association of Canada, 2006). Approximately 0.3% of BC's forests are harvested annually, and fire protection is the only management activity currently practiced over a large area of the land base.
The current age distribution of forests in BC is skewed toward old trees, resulting in increased sensitivity to disturbance by fire and pests (Cammell and Knight, 1992; Dale et al., 2001; Volney and Hirsh 2005). Climate changes are considered a contributing factor to recent increases in fire activity (Gillett et al., 2004) and outbreaks of the mountain pine beetle (Carroll et al., 2004) and needle blight (Woods et al., 2005). As illustrated by the Kelowna and Barriere fires in 2003, forest fires have a direct impact on property and safety (Volney and Hirsch, 2005), with health impacts extending considerable distances from the fire. The economic and social impacts of mountain pine beetle are discussed in detail in Section 4.2. Continued climate change is expected to further increase disturbance risks, and involve other pest species, such as the leader weevil (Sieben et al., 1997). Coastal forests will likely see an increase in the number and intensity of storms, thereby increasing windthrow damage. Drier areas of the southern interior may experience regeneration problems due to an increase in summer droughts.
Climate change directly affects tree species, as optimum growth conditions for local populations can be relatively narrow (Rehfeldt et al., 1999, 2001; Parker et al., 2000; Wang et al., 2006). Consequently, although species may survive in their current location under a changed climate, growth rates will be affected and there will be increased competition from other species more suited to the climate. The potential ranges of species will move northward and upward in elevation (Cumming and Burton, 1996; Hebda, 1997; Hansen et al., 2001; Hamann and Wang, 2006), although species migration will be constrained by barriers to movement, slow migration rates, unsuitable soils or lack of habitat (Stewart et al., 1998; Gray, 2005). Overall, losses in productivity of natural and planted stands are expected to occur in the drier and warmer regions of BC, while modest increases are anticipated in the north (Rehfeldt et al., 1999, 2001; Spittlehouse, 2003; Johnson and Williamson, 2005).
Forestry operations will be impacted directly by climate change. Changes in productivity will affect rotation ages, wood quality, wood volume and size of logs. Access to timber may be limited during both winter, because of warmer and wetter conditions, and summer, due to increased fire risk. Increases in the frequency and magnitude of extreme precipitation will affect design and maintenance of logging roads (Bruce, 2003; Spittlehouse and Stewart, 2003), and increase the probability of landslides and debris flows (Wieczorek and Glade, 2005). Impacts on the forest sector will also be influenced by technological changes, trade issues and changes in consumer preferences that will take place concurrent with climate change. Countries that are expected to see significant production benefits from a changing climate, particularly those in South America and Oceania, are already replacing BC products in the global market (Perez-Garcia et al., 2002; Sohngen and Sedjo, 2005). Such changes affect forestry product supply-demand dynamics.
Adaptation
The long growth period before trees are harvested means that the wood supply for the next 50 or more years is already ‘in the ground'. As a result, short-term adaptations will focus primarily on operational changes. Already, the increase in disturbance by fire and insects has resulted in greater amounts of the harvest being salvaged wood, a trend that will continue in the future (Spittlehouse and Stewart, 2003; Volney and Hirsch, 2005). Forest management adaptation will also have to consider climate change impacts beyond those directly affecting timber resources, in order to maintain biodiversity and ensure landscape connectivity (cf. Harding and McCullum 1997; Stenseth et al., 2002; Mote et al., 2003; Moore et al., 2005). In addition, increased competition from species more suited to changed climate conditions may create a need for increased management activities in established stands (Parker et al., 2000; Spittlehouse and Stewart, 2003; Spittlehouse, 2005).
Longer term adaptation measures include changes in reforestation practices, especially species selection, as the tree types best suited to particular sites change (Rehfeldt et al., 1999; Parker et al., 2000; Spittlehouse and Stewart, 2003). Wang et al. (2006) showed that a mid-range climate change scenario for BC shifts seed planting zones for lodgepole pine many hundreds of kilometres north. However, matching planting stock to new climate regimes is further complicated by the climate continuing to change over the life of the stand. In this case, planting genotypes that grow well under a wide temperature range could help maintain productivity at some sites in BC (Wang et al., 2006).
Although consideration of weather and climate is part of forest management, current policies on forest utilization and preservation are based on understanding how forests developed under past climatic conditions. This may limit the ability of the sector to respond optimally to both the negative and potentially positive impacts of climate change on different forest regions.
There are presently no requirements or guidelines to include climate change adaptation measures in forest management plans, and there are limited experienced personnel to aid such activities (Spittlehouse and Stewart, 2003; Spittlehouse, 2005). As most of BC's forests are on crown land, the provincial government is responsible for setting policies, developing management objectives and approving forest company stewardship plans. The government also sets standards for species selection, seed transfer and stocking; allocates land to parks and wilderness areas; and is responsible for maintaining forest health and growth-monitoring plots. In this context, Spittlehouse (2005) noted the need for more comprehensive assessment of vulnerability to climate change and developing and applying adaptation measures for forest management. The actions of the BC Ministry of Forests and Range outlined in Section 4.2.2 are a first step in this process.
3.4 AGRICULTURE
British Columbia's mountainous landscape and climatic diversity result in only 4.5% of land being suitable for farming. The protection of this limited resource was a major factor in the creation of a 4.7 million ha Agricultural Land Reserve (ALR) in 1974. The ALR is a useful institutional tool to help manage and maintain the province's agricultural resources under climate change and other compounding demands.
More than 200 major commodities are produced by BC's agri-food industry, which directly and indirectly employs about 290 000 people, or about 14% of the province's employed labour force (BC Ministry of Agriculture and Lands, 2005a). The primary industry is relatively small, but spin-offs in the food processing, wholesaling, retailing and food service sectors are worth more than $22 billion per year in consumer sales (BC Ministry of Agriculture and Lands, 2005b). Nearly 60% of the food needs of British Columbians are produced in the province (Smith, 1998), and BC exports food products valued at more than $3.4 billion (BC Ministry of Agriculture and Lands, 2005a, b). Agricultural production is concentrated in rural communities, where it provides stability to local resource-based rural economies.
The vulnerability of the agricultural sector in BC is a product of the interaction of specific climate changes with global and regional issues, including new markets and competitors, and production and transportation costs (Heinberg, 2003). Recent trends in the agriculture sector include a declining role in B's economy; increased reliance on imports from other parts of Canada, the United States and Mexico; increased production of nursery and greenhouse products; declines in food processing capacity; increasing concerns surrounding food safety; and declines in consumer demand for meat products (BC Ministry of Agriculture and Lands, 2005a). Non-climatic risks to the agriculture sector include loss of arable land through development and urban sprawl, an increasingly competitive global market, and unmanageable and unpredictable markets.
Potential effects of climate change have been previously assessed for agriculture in British Columbia (Table 6) based on expert judgment (Zebarth et al., 1997). In all areas of the province, longer growing seasons and milder winters were expected to increase the range of crop types suitable for economic production. Increasing requirements for irrigation were predicted for the south coast and southern interior regions, with possible water shortages caused by reduced precipitation, limited water storage capacity and competition from burgeoning urban populations. The greatest potential for development was considered to be in the northern interior and Peace River regions, with large areas of currently uncultivated land becoming increasingly suitable for agriculture. Lack of infrastructure for water supply, transportation and distance from markets, however, were considered barriers to agricultural development in these areas.
South coastal region
Current climate:
Mild, wet climate.
Mean annual temperature: 10°C.
Mean annual precipitation: 800–1700 mm, 70% of which falls between October and March
Frost free period: 175–240 days
Future temperature:
Projected to increase 2–3°C
Future precipitation:
Projected to increase from November to May (5–10%)
Projected to decrease from June to October (10–20%)
| Type of agriculture | Current agriculture | Climate limitations | Effects of future temperature change | Effects of future precipitation change |
|---|---|---|---|---|
| Horticulture | Small fruit: raspberry, strawberry, blueberry Field vegetables: corn, potato, cabbage family crops, salad crops |
Perennials: summer moisture deficits, require some irrigation Raspberries: winter damage from Arctic outflow Field vegetables: low temperatures, wet soil conditions in spring |
Warmer summer: increased productivity Warmer winter: longer growingseason; increased viability of bell pepper, melon, overwintering cabbage family crops and double cropping Increased winter precipitation could limit annual crop production in water-logged soils Decreased summer precipitation could mean that more irrigation is required Reduction in diseases due to drier conditions could favour berry production |
Increased winter precipitation could limit annual crop production in water-logged soils Decreased summer precipitation could mean that more irrigation is required Reduction in diseases due to drier conditions could favour berry production |
| Forage crops | Grass: pasture, hay, silage Corn: silage |
Grasses: winter damage from Arctic outflow Forage crops: summer moisture deficit, require irrigation on Vancouver Island |
Warmer spring: earlier harvest of forages New, heat tolerant forage species required |
Increased spring precipitation could limit harvest and quality of forages Dry, hotter summer could mean that irrigation will be required in Fraser River valley |
| Greenhouse | Vegetables: cucumber, tomato, bell pepper Ornamentals |
Warmer winter: lower heating costs, increase in tropical species Hotter summer: higher cooling costs |
||
| Other effects | Increased pest pressure: winter survival of pests and diseases, more life cycles | Flooding, soil drainage, soil compaction, increased leaching of agricultural chemicals | ||
| Southern interior region | ||||
| Horticulture | Perennials: apple, pear, peach, plum, cherry, wine grape Field vegetables: tomato, pepper, eggplant, cucumber |
Perennials: summer moisture deficits could require irrigation; winter damage from Arctic outflow Field crops: summer moisture deficits could require irrigation |
Warmer winter: longer growing season; new, longer season varieties; reduced risk of cold damage Earlier spring: increased frost risk Warmer summer: increased risk of poor fruit quality Warmer summer: higher grape quality |
Increased winter precipitation could keep soils wet and reduce risk of cold damage to roots; could improve spring moisture availability Decreased summer precipitation could mean that more irrigation is required Reduction in diseases due to drier conditions; reduction in cherry splitting |
| Forage crops | Grass: pasture, hay, silage Others: alfalfa, corn, cereals Extensive dry rangeland |
Summer moisture deficit may require some irrigation Low winter temperatures may limit production |
Warmer spring, longer growing season: more harvests of forages, more range grazing New, heat-requiring species viable (silage corn) |
|
| Greenhouse | Vegetables: cucumber, tomato, bell pepper Ornamentals |
Warmer winter: lower heating costs Hotter summer: higher cooling costs |
||
| Other effects | Increased risk of limited water supply for irrigation Increased pest pressure: winter survival of pests and diseases, more life cycles. |
Increased risk of limited water supply for irrigation | ||
| Northern interior region | ||||
| Forage crops | Grass: pasture, hay, silage Cereals Extensive natural rangeland |
Summer moisture deficit may require some irrigation Low winter temperatures may limit production Short growing season will limit choice of crops |
Warmer spring: longer growing season, higher productivity, more range grazing New, heat-requiring species viable (silage corn) |
Increased winter precipitation could keep soils wet and reduce risk of cold damage to roots; could improve spring moisture availability Decreased summer precipitation could mean that more irrigation is required Reduction in diseases due to drier conditions; reduction in cherry splitting |
| Other effects | Increased risk of limited water supply for irrigation Increased pest pressure: winter survival of pests and diseases, more life cycles |
Increased risk of limited water supply for irrigation | ||
1 except August (increase of 5%)
It is likely that crop production areas will adjust to accommodate a changing climate and that some producers will be able to take advantage of new opportunities to grow different, and perhaps more valuable, crops (Zebarth et al., 1997). In BC, crop production areas are defined by soil productivity, water availability and climate. Growing regions for annual crops are limited by length of the growing season and heat units (growing degree days, or GDD). Perennial crops are limited primarily by winter minimum temperatures, but also by length of growing season and GDD. Current agricultural land-use patterns are based on long-term experience, and defined by climate and the frequency of extreme weather events (Caprio and Quamme, 1999, 2002, 2006). Under a moderate climate change scenario, projected changes in GDD (Royal BC Museum, 2005a) indicate that, by 2020, there would be potential to grow cereals, cabbage and potatoes (1000 –1500 GDD) on much of the Interior Plateau, and corn and tomatoes (1500–2000 GDD) along the Fraser River as far north as Prince George. By the 2050s, GDD would be sufficient to potentially support growth of corn and tomatoes in the Peace River area and in northern coastal valleys. Full understanding of changes in agricultural suitability, particularly for perennial crops, requires assessment of future growing season length, boundaries for extreme minimum winter temperatures and the potential for irrigation in water-limited regions, as well as development of detailed soil maps for non-agricultural areas. Estimations of potential future land-use patterns also need to consider topographically defined microclimates, which ultimately determine crop location (e.g. Bowen et al., 2006).
In all areas of BC, the possibility of increased summer drought, coupled with decreasing water resources, will provide challenges for water supply to support irrigation (Zebarth et al., 1997; Neilsen et al., 2004a, b). In areas that are highly or entirely dependent on irrigation, such as the Okanagan basin, economic production requires timely availability of water, both to assure quality and to protect investment in perennial plants. The risks associated with drought are determined by the severity and frequency of drought conditions (Neilsen et al., 2006). For the Okanagan (see Section 4.3.2) and other regions, a key adaptation by the agriculture sector will likely involve conservation irrigation practices (Neilsen et al., 2001, 2003), including deficit irrigation, where water is underapplied to enhance crop quality and reduce consumption (Dry et al., 2001).
Although few data are available for BC, increased summer and winter temperatures may also result in new agricultural pests and diseases.
Risk Perception and Adaptation
Agricultural producers are accustomed to dealing with uncertainty in weather, markets, pests and diseases, and potential income. Grower surveys in the Okanagan region showed that producers face weather-related risks, risks from market factors and risks from the impacts of pests and diseases on crop quality and quantity (Belliveau et al., 2006a, b; see Section 4.3.2). Responses to address weather-related risks can be either short or long term, ranging from specific practices to processing and/or product choices (Belliveau et al., 2006a, b). A risk-management strategy to handle one problem may inadvertently increase risk in another. For example, the grape pullout program in 1988 and the apple replant program from 1992 onwards have increased vulnerability to climate risks (see Section 4.3.2). Support programs, such as the Canadian Agriculture Income Stabilization Program, may be a disincentive for producers to take other adaptation measures to reduce risks (Belliveau et al., 2006a, b). In general, safety net programs are a good hedge against crop losses caused by weather but are less effective in sheltering farmers against losses caused by more subtle impacts on quality and by the longer term persistence of climate change.
3.5 TOURISM AND RECREATION
Tourism is BC's second largest economic sector next to forestry, generating approximately $5.8 billion in 2003 and $9.5 billion in 2004 (BC Ministry of Labour and Citizens' Services, 2005b; Tourism BC, 2005a). Tourism provides more than 117 500 jobs, approximately 7% of total provincial employment (Hallin, 2001; Tourism BC, 2005a). Although Vancouver and Victoria are major urban destinations, visitors are also drawn to BC's mountains and coastal regions. Many resource-based communities now view tourism as a means of economic restructuring after declines in the forestry and fishery sectors (Reed and Gill, 1997).
British Columbia's scenery, wilderness, wildlife viewing, and hunting and fishing opportunities provide for a burgeoning adventure and nature-based tourism industry. In 2001, nature-based tourism contributed $1.55 billion in revenues (including spin-off activities) and $783 million in provincial GDP (Tourism BC, 2005a, b). Most of this occurs at destination resorts and within BC's many parks and protected areas (see Section 3.6).
The effects of climate change on tourism destinations are already evident. In BC's drier southern interior, drought and forest fires during the summer of 2003 closed many major transportation routes and destroyed orchard and winery crops in the Okanagan and North Thompson valleys. Agri-tourism to wineries and orchards was impacted and regional hotel room revenues declined by 3% (BC Council of Tourism Associations, 2004). These areas and activities can expect increasing frequency of drought hazards in the future.
Projected rises in snowlines due to warming temperatures (Scott, 2003a, b, 2006a) will impact ski operations across the province. For example, the retreat of alpine glaciers that support off-season skiing will affect mountain resorts such as Whistler-Blackcomb. Inadequate snowfall reduces the number of suitable skiing days available to local resorts, such as Vancouver's Grouse, Seymour and Cypress mountains (Scott et al., 2005).
Tourism in coastal communities will be affected by sea-level rise and increased coastal erosion and flooding hazards (Craig-Smith et al., 2006), and associated impacts on transportation infrastructure, marina maintenance and dredging activities, boating safety, floatplane travel, vacation housing and resort infrastructure. Key impacts on coastal fisheries relevant for sport fishing are discussed in Section 3.2.
Adaptation
Successful tourism operations are inherently dynamic and resilient to environmental and other changes. This adaptive capacity suggests that the sector is relatively well positioned to respond to climate change impacts (Scott et al., 2003). Adaptation measures typically involve short-term responses, such as marketing strategies aimed at changing tourist behaviour, or longer term planning to adjust to local climate change impacts. However, climate change is only one of many factors to which tourism operations must adapt. Other key factors include changing market competition, fluctuating currency values, and changing tourist demands, interests and demographics (Uysal, 1998). Adaptive measures, such as re-marketing, re-imaging and diversification of activities, are already happening. For instance, Tofino, a traditionally popular summer tourist destination on Vancouver Island's west coast, is now also attracting tourists for winter storm watching (Dewar, 2005).
A key adaptation strategy for weather-dependent tourism is to spread the risk by diversifying operations and reducing reliance on single-season activities. Ski resorts are adapting to recent climate change through snowmaking and introduction of activities that are not dependent upon snow (Scott et al., 2003; Scott, 2006b). Snowmaking is capital intensive and requires significant water resources that, in many regions, are already under stress. Larger, multi-resort corporations have a higher adaptive capacity than smaller operators, as they generally have greater access to capital to undertake adaptation and are less impacted by poor conditions at a single site. The longer, more predictable ski season that snowmaking can produce reduces business risks during the winter and further stimulates diversification. In turn, this encourages property and infrastructure investments throughout the year (Scott, 2006b). For example, the Whistler-Blackcomb resort has diversified itself into a multi-season resort that includes golfing, mountain biking and alpine hiking. Some of these activities use the same infrastructure used in the winter for skiing.
Other important adaptive measures include hazard risk reduction and comprehensive emergency management to deal with increased floods, landslides and avalanches associated with wetter and warmer fall-winter conditions.
3.6 PARKS AND PROTECTED AREAS
British Columbia has the highest biodiversity of any province and hosts some of Canada's most vulnerable and fragmented ecosystems. There are 859 protected areas in BC, accounting for more than 13% of the landscape (approx. 12.6 million hectares). Climate change impacts in Canada's national parks are only beginning to be considered, for example, through identification of key ‘geoindicators’ for monitoring changes (Welch, 2002, 2005). Impacts on ecosystem integrity from species migrations and major biome shifts, expected as a result of climate change, have yet to be considered (Scott and Lemieux, 2005). Compared to terrestrial areas, marine protected areas are under-represented, with less than 1% of BC's waters fully protected. Climate change impacts on sea-surface temperatures, species migrations and diversity, and ocean productivity have received little consideration in the planning and management of marine protected areas.
The ClimateBC program was used to simulate changes in temperature and precipitation, at a downscaled resolution of 1 km 2, within selected protected areas (Table 7; Hamann and Wang, 2005, Wang et al., 2006) to assess possible ecosystem responses. Such modelled results need to be considered in the context of past ecosystem dynamics, changes in disturbance regimes (fire, invasive species, pests), land management objectives and human demands on resources, to contribute to the development of adaptive management plans addressing multiple objectives.
| Elevation (m) | Mean annual temperature (°C) | Mean warmest month (°C) | Mean coldest month (°C) | Mean annual precipitation (mm) | ||||||
|---|---|---|---|---|---|---|---|---|---|---|
| Normal | 2050 | Normal | 2050 | Normal | 2050 | Normal | 2050 | |||
| Tweedsmuir Provincial Park (PP) | 1254 | 1.2 | 3.4 | 11.3 | 13.4 | -9.7 | -7.0 | 914 | 938 | |
| Wells Gray PP | 1487 | 0.8 | 3.0 | 11.7 | 13.9 | -10.1 | -6.7 | 1203 | 1241 | |
| Spatsizi PP | 1522 | -2.4 | 0.3 | 10.0 | 12.7 | -13.9 | -9.4 | 906 | 969 | |
| Garibaldi PP | 1580 | 2.1 | 4.2 | 11.7 | 13.7 | -6.2 | -3.9 | 2745 | 2852 | |
| Granby PP | 1759 | 1.6 | 3.9 | 12.8 | 15.0 | -8.6 | -5.9 | 966 | 973 | |
| Kootenay National Park (NP) | 1830 | -0.1 | 2.4 | 11.6 | 13.9 | -12.1 | -8.3 | 1082 | 1099 | |
| Glacier NP | 1829 | -0.5 | 1.8 | 10.7 | 12.9 | -11.3 | -7.8 | 1988 | 2057 | |
| Gulf Islands NP Reserve | 84 | 9.7 | 11.8 | 16.2 | 18.3 | 3.8 | 5.9 | 798 | 842 | |
| Mean summer precipitation (mm) | Mean annual snowfall (mm) | Frost-free days | Growing degree days (GDD; >5 °C) | Day of year when GDD total 100 (budburst) | ||||||
| Normal | 2050 | Normal | 2050 | Normal | 2050 | Normal | 2050 | Normal | 2050 | |
| Tweedsmuir PP | 253 | 246 | 493 | 416 | 124 | 158 | 682 | 1029 | N/A | 145 |
| Wells Gray PP | 456 | 457 | 616 | 540 | 126 | 159 | 703 | 1049 | 166 | 145 |
| Spatsizi PP | 406 | 424 | 477 | 467 | 103 | 138 | 423 | 737 | 179 | 155 |
| Garibaldi PP | 569 | 538 | 1402 | 1077 | 136 | 169 | 725 | 1047 | 169 | 152 |
| Granby PP | 407 | 383 | 445 | 361 | 135 | 169 | 815 | 1163 | 165 | 147 |
| Kootenay NP | 500 | 486 | 518 | 459 | 116 | 150 | 678 | 1040 | 166 | 144 |
| Glacier NP | 565 | 555 | 1230 | 1126 | 121 | 152 | 542 | 852 | N/A | 157 |
| Gulf Islands NP Reserve | 157 | 146 | 42 | 30 | 322 | 349 | 1957 | 2688 | 89 | 27 |
Tourism, traditional Aboriginal resource use, park operations and research are the main human activities in BC's parks. Key climate change risks to be managed in the park system include 1) alpine and subalpine ecosystem decline and fragmentation due to increased temperatures (Scott and Suffling, 2000; Suffling and Scott, 2002); 2) increasing impacts from natural hazards (avalanches, wind storms, storm surges, droughts and landslides) as a result of increased frequency and/or magnitude of extreme weather, affecting visitor safety and maintenance of park infrastructure and services; and 3) species migration, extirpation and increasing exotic species competition, impacting harvest rights, biodiversity and population sustainability for both terrestrial and marine species. The most vulnerable protected areas are those subject to intense human activity and development pressures, such as those in the Greater Vancouver –lower mainland region, on southern Vancouver Island and in the Okanagan valley.
Adaptation
Climate change represents a challenge to the fundamental goal of most protected areas, and requires that a dynamic perspective be applied to the concept of maintaining ecological integrity. Parks Canada has developed a list of possible responses to current and future climate change impacts, including enhancing connectivity to enable species migration, expanding some protected areas, limiting other stressors on ecosystems, and species relocation programs (Hannah et al., 2002; Welch, 2005). Similarly, conservation networks between protected areas in developed regions would help facilitate species movements and biodiversity conservation under a changing climate. Monitoring and research on species and ecosystem responses remain important, as this helps to document impacts and inform adaptive planning and management approaches. Protected areas serve as ‘benchmarks’ for adaptive ecosystem management within larger landscapes subject to the additional pressures of resource extraction, agricultural use and urban development.
3.7 ENERGY
Discussions of climate change and energy typically focus on the links between energy production and greenhouse gas emissions. In British Columbia, where 89% of the province’s electricity is hydro generated (BC Hydro, 2006), the energy sector is highly sensitive to the impacts of climate change on water resources (see Sections 2.4, 3.1 and 4.3.1). Research on climate change impacts and potential adaptive measures of the energy sector in BC is extremely limited. However, the following considerations are beginning to attract the attention of energy researchers and managers:
- Water shortages are already a risk for BC's hydroelectric resources. Storage reservoirs face reduced snow packs, declining glacier contributions and frequent drought, all of which tax the system's capacity to meet demands (BC Hydro, 2004).
- Electricity demand in BC by 2025 is expected to be 33 to 60% higher than in 2005 (BC Hydro, 2006). All new electricity generation measures, including coal-fired plants, are planned for zero net greenhouse gas emissions (BC Ministry of Energy, Mines and Petroleum Resources, 2007).
- Seasonal and longer term energy demands for buildings (e.g. increased summer cooling needs, lower heating requirements) will change across the province in response to changing climate. By 2010, new energy-efficient bulding standards are proposed for implementation (BC Ministry of Energy, Mines and Petroleum Resources, 2007).
British Columbia's main hydroelectric generation reservoirs on the Columbia and Peace rivers depend on water flows mainly from snow pack and/or glacial melt. Some smaller ‘run-of-river’ facilities have limited storage and require continuous flow. Studies of the impacts on water supply and hydroelectric generating vulnerabilities are ongoing in the Williston-Peace, Bridge River and Columbia River basins, and current climate variability is an important consideration in planning reservoir operations strategies (BC Ministry of Environment, 2004).
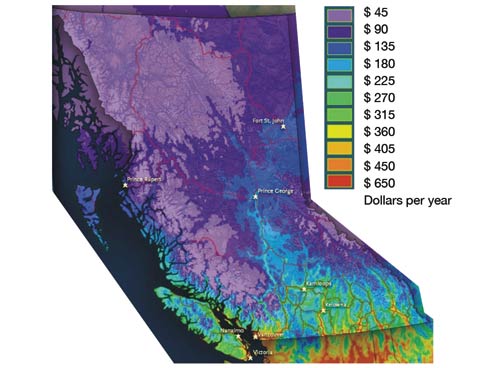
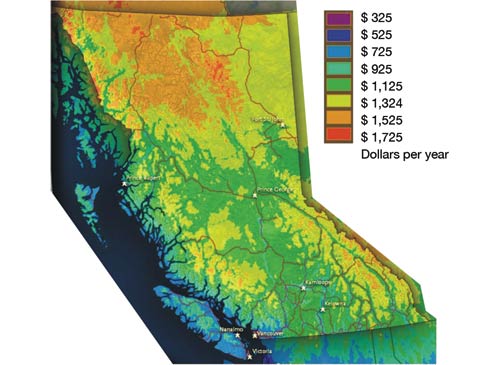
Substantial shifts in energy demand are also anticipated as a result of increasing temperatures, with heating energy demands decreasing and cooling energy demands increasing. Illustrative models developed by the Royal BC Museum (2005b), based on projected changes in cooling and heating degree days, suggest that domestic heating energy demand may decrease 28 to 55% and summer cooling demand may rise 150 to 350% by 2080 in the Vancouver region (Figures 8 and 9).
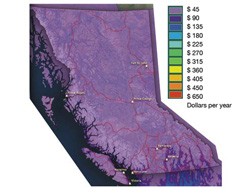
FIGURE 8a: Baseline summer cooling costs for a typical British Columbia house (Royal BC Museum, 2005b)

FIGURE 8b: Projected summer cooling costs for 2080 for a typical British Columbia house, based on a high change climate scenario (Royal BC Museum, 2005b)
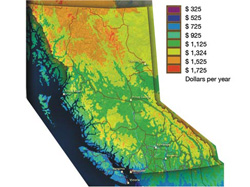
FIGURE 9a: Baseline winter heating costs for a typical British Columbia house (Royal BC Museum, 2005b)

FIGURE 9b: Projected winter heating costs for 2080 for a typical British Columbia house, based on a high change climate scenario (Royal BC Museum, 2005b)
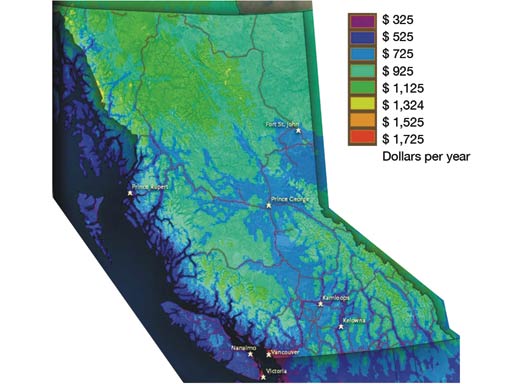
Adaptation
BC Hydro aims to meet approximately 50% of increased electricity demands by 2020 through conservation and efficiency measures, including programs for consumers and the construction industry (BC Ministry of Energy, Mines and Petroleum Resources, 2007). Numerous programs exist that promote energy efficiency (e.g. BC Sustainable Energy Association, 2006; BC Ministry of Energy, Mines and Petroleum Resources, 2006; FortisBC, 2006; Natural Resources Canada, 2006). These and similar initiatives have both mitigative and adaptive benefits, in that they reduce greenhouse gas emissions and reduce demands on climate-sensitive sources of electricity.
Independent power producers, potentially including coal-fired generating plants, and efficiency improvements to existing hydroelectric plants will supply British Columbia ’s remaining future demands (BC Hydro, 2006). BC Hydro’s (2006) Integrated Electricity Plan states that at least 50% of new power supply needs will come from renewable sources, including hydroelectricity, biomass and wind power. All new power generation facilities and coal-fired plants are planned for zero net greenhouse gas emissions (BC Ministry of Energy, Mines and Petroleum Resources, 2007).
Future energy demand forecasts and resource supply options must consider climate change impacts, as improved energy efficiency measures and building designs will only alleviate some of the expected increases in power demand. Improvements in stream-flow prediction modelling that consider changing climate represent a starting point in assessing supply vulnerabilities for hydroelectric power generation. Potential adaptation measures include expansion of reservoir systems to include supplemental ‘pumped-storage’ facilities, which store water above the reservoir to supply a generating station.
3.8 CRITICAL INFRASTRUCTURE
Critical infrastructure includes various technology networks, facilities, systems and services that are key to the well-being and operations of society (Public Safety and Emergency Preparedness Canada, 2006b). It involves a multitude of systems for energy and public utilities, health care, transportation, food supply, industry, communications and information technology, finance, safety and rescue, and defence. Impacts of recent extreme weather events demonstrate that vulnerabilities exist in these interconnected and interdependent systems. British Columbia's Emergency Response Management System (BC-ERMS; Public Safety and Emergency Preparedness Canada, 2006a) reports on, and aims to reduce the impacts of, environmental hazards, such as floods and wildfires. Critical infrastructure protection and planning, however, resides with a host of public agencies from all levels of government.
In 2003–2005, British Columbia experienced a significant increase in the number of extreme weather events requiring widespread emergency responses, compared to the previous decade (Table 8). Such emergencies are managed through BC-ERMS when the impacts to a community or significant infrastructure are likely to overwhelm the response capacity of local authorities. The BC-ERMS organization recognizes the potential for increasing frequency and severity of such natural hazard risks as wildfires, flooding, drought, mass-wasting events and pest proliferation as a result of climate change. The system is both reactive, through financial claims support to communities, businesses and homeowners, and proactive, through support to local authorities and communities for hazard risk-reduction initiatives and education and awareness programs. The maximum support for individual damage claims has recently been tripled from $100 000 to $300 000 (Whyte, 2006). By increasing risk awareness and emergency preparedness, BC-ERMS also enhances adaptive capacity to address climate change adaptation.
| Parameter | 1990–2002 | 2003–2005 |
|---|---|---|
| Average number of threshold events1 per year | 1 | 2 |
| Number of major Disaster Financial Assistance (DFA) events per year | 2–3 | 3–5 |
| Average DFA and response costs | $10 million | $43 million |
| Frequency of evacuations | Every 2–3 years | 2 times/year |
| Frequency of States of Emergency (SOE) | Rare | 1 provincial SOE and 10 local SOEs in 3 years |
1 A threshold event is one where eligible costs reach $4 million.
Transportation
Transportation and associated activities (e.g. warehousing, pipelines, sightseeing, couriers) are an important component of BC ’s economy, accounting for 6% of the provincial GDP and employing 6% of the workforce (more than 115 000 people) in 2004 (BC Ministry of Labour and Citizens ’ Services, 2005a). Road, rail, air and marine transport are all important components of the transportation system, providing critical links for other key economic sectors (e.g. forestry) to associated processing facilities and markets. More than 65 000 km of roads in BC carry more than 2 million passenger and service vehicles per year (Transport Canada, 2005). Almost 65% of the network is provincially owned, 32% is municipal and 3% is federal. In the area of marine transport, British Columbia has more than 135 public and private ports that facilitate 95% of international trade moving through the province (BC Ministry of Small Business and Economic Development and Ministry of Transportation, 2005). Goods shipped to and from the three main trading ports of Vancouver, Fraser Port and Prince Rupert are moved by rail (66%) and truck (33%), with shipping container traffic projected to triple from 2 to 6 million containers per year by 2020 (Greater Vancouver Transportation Authority, 2005).
Climate change impacts BC’s transportation infrastructure in many ways. Increases in the frequency of some extreme weather events will increase maintenance and insurance costs, and expose the limitations of some current design standards. Wear on highways, although primarily a function of vehicle weight and traffic volume, is also impacted by climate conditions. For example, rising maintenance costs in Prince George are partly attributed to more frequent freeze-thaw events associated with recent warmer winters (Dyer, 2006). Climate change will also have positive impacts on transportation. For example, during the El Niño winter of 1997–1998, milder weather helped to significantly reduce motor vehicle accidents on BC roads (Environment Canada, 2003).
Utilities and Services
Water supply and stormwater management systems in BC will continue to be impacted by changing climate and increasing development pressures. Key impacts to be considered include:
- decreased water supplies during summer and fall (see Sections 2.4 and 3.1);
- supply-demand mismatches in reservoir systems that supply BC's major urban centres (see Section 4.4.1);
- increased demands on drinking water and sewage treatment facilities in rapidly growing communities; and
- increased loading of stormwater management systems as a result of more frequent and/or more intense extreme precipitation events (see Section 4.4.2).
Major pipeline infrastructure expansions are planned for the near future to move producible oil and natural gas from the northern territories and northeastern BC to international markets. The impacts of a changing climate in mountainous and permafrost regions of BC (e.g. permafrost melt, landslides, rockfalls) need to be considered in the planning, design and construction of pipeline infrastructure to avoid increased maintenance costs and, potentially, major repair and environmental rehabilitation efforts.
3.9 HEALTH
Vulnerability of human health is a function of interacting biological, environmental and socioeconomic factors (e.g. immunity, urban setting, income, access to health care services; Woodward et al., 2000). Climate change poses both direct and indirect health threats at the individual and population levels. Direct threats include increases in the number of injuries, illnesses and deaths related to poor air quality, natural hazards, extreme weather and heat. Indirect threats include exposure to air-, water- and vector-borne diseases and declines in ecosystem health (McMichael et al., 2003; Haines and Patz, 2004).
Heat Stress and Air Quality
Heat stress is associated with thousands of deaths each year in Canada (Smoyer-Tomic et al., 2003). More frequent, intense and longer lasting heat waves associated with climate change are expected to produce significant heat-related impacts, including heat stroke, dehydration and cardiovascular-respiratory illness and mortality (McGeehin and Mirabelli, 2001). The impacts of recent heat waves elsewhere in the world demonstrate that vulnerable populations include seniors, children, the poor and those who are socially isolated (Klinenberg, 2002; Crabbe, 2003). Although heat stress may appear less threatening in BC compared to central Canada (see Chapters 5 and 6), much of the BC population is less acclimatized to temperatures above 30 °C (Smoyer-Tomic et al., 2003). Large urban populations in the Greater Vancouver Region and the Okanagan valley are particularly vulnerable. Non-respiratory emergency room visits in Vancouver currently increase with high summer temperatures (Burnett et al., 2003) and are expected to increase further with an aging population.
Air pollution increases in urban areas already exposed to air-quality hazards, particularly Greater Vancouver, Prince George and the Okanagan valley, will also have significant health consequences. Airborne pollutants cause wheezing, asthma attacks and impaired lung function, and are associated with increased respiratory illness, stroke, heart attack and premature death, especially for the elderly and children (Brook, 1998; Burnett et al., 1998; Caulfield, 2000; Kondro, 2000; Van Eeden et al., 2001; Brauer et al., 2002, 2003). Expected increases in forest fire frequency associated with changing climate will increase exposures to fine particulate matter from wood smoke (cf. Dods and Copes, 2005). Fine particulate matter is linked to premature deaths, exacerbation of asthma, acute respiratory symptoms and chronic bronchitis, and decreased lung function, especially in children (Vedal, 1993).
Together, increasing heat stress and exposure to air pollution will increase illness, absenteeism, hospitalization and premature mortality. Already, the annual health burden of outdoor air pollution for BC is estimated at approximately $85 million (BC Ministry of Health, 2004).
Disease Exposure
Diseases spread by water, vectors (e.g. animals, insects) and air are expected to increase as a result of climate change. Water-borne diseases are likely to increase in some areas of BC as a result of increased precipitation and flooding. Twenty-nine waterborne outbreaks have occurred in the province since the 1980s, due to parasites, bacteria and viruses in drinking water systems (Mullens, 1996; Wallis et al., 1996). Boil-water advisories are common. Three hundred and four were issued in August 2001 (BC Ministry of Health Planning and Ministry of Health Services, 2001). Extreme precipitation also contributes to elevated turbidity levels that reduce the effectiveness of drinking water disinfection systems. During November 2006, a boil-water advisory was issued by Greater Vancouver Regional District (GVRD) Medical Health officers that affected almost 1 million people for 12 days following an extreme rainfall that led to turbidity levels “unprecedented in recent years” (Greater Vancouver Regional District, 2006). First Nations communities are particularly vulnerable to water-quality advisories and currently experience more than the rest of Canada, due to poor infrastructure.
Climate change will enable many disease vectors, such as mosquitoes, ticks and rodents, to extend their range and thereby increase human exposure. For instance, the mosquito-borne West Nile virus, although not yet found in BC, is spreading due, in part, to changing climate, and may become one of North Americas ’ leading arboviral diseases (Morshed, 2003). Encephalitis and Lyme disease from ticks may expand in range with expected warmer winters, as observed in Europe in the 1990s (Lindgren et al., 2000).
In 1994, the first Canadian case of hantavirus pulmonary syndrome (HPS) was identified in BC (Stephen et al., 1994), and 50 more cases have emerged since then (BC Ministry of Health, 2005). In the United States, HPS epidemics are linked to rising rodent populations associated with climate and ecological changes (Wenzel, 1994; Engelthaler et al., 1999; Glass et al, 2000). Rodent breeding capacity is increased by mild winters (Mills et al., 1999; Drebot et al., 2000), conditions that are likely to be exacerbated by climate change.
Cryptococcus gattii, a tiny tropical yeast-like fungus, was identified on Vancouver Island in 1999 and more recently by the Vancouver Coastal and Fraser health regions (BC Centre for Disease Control, 2005). After inhalation, the fungus can cause serious illness and occasional death as it affects the lungs (pneumonia) and nervous system (meningitis). The changing distribution of this pathogen is linked to warming conditions (Kidd et al., 2004).
Food Security, and Public Safety and Well-being
Climate change will affect access to food resources, particularly for rural and First Nation communities that rely on hunting, trapping, gathering and fishing for subsistence (O ’Neil et al., 1997; Wheatley, 1998), thus exacerbating existing food insecurities (Willows, 2005).
Harmful algal blooms (HAB), or ‘red tides’, can flourish in summer months during extended warm periods. Increases in ocean surface temperature and storminess associated with climate change are stimulating HABs in British Columbia (Mudie et al., 2002). The most toxic red tides result from dinoflagellates, which cause illness or fatalities if large amounts of diseased shellfish are consumed (Mudie et al., 2002). Severe incidents of paralytic shellfish poisoning (PSP) have occurred on the BC coast (Taylor, 1993). In June 2006, most shellfish harvesting areas on Vancouver Island and the Gulf Islands were closed for several weeks. Rising ocean surface temperatures, in conjunction with the expansion of aquaculture in BC, can be expected to increase the incidence of economic and health impacts from harmful algal blooms.
Drinking water security is a major concern for water-stressed regions. Historically reliable water sources are not an assurance of continued supplies, as evidenced by the experience of Tofino, a resort town on the west coast of Vancouver Island. Tofino, accustomed to a very wet climate, experienced a major water shortage in the summer of 2006 due to increasing water demands and prolonged summer drought. The vulnerability of such communities to water shortages and related health impacts will likely increase due to climate change and increasing development pressures. The Drinking Water Protection Act (BC Statutes and Regulations, 2001) is intended to strengthen water protection in BC, but mentions little about adapting to climate change.
The increasing frequency of extreme weather events, such as flooding, storm surges, landslides and wildfires, constitutes a significant risk to public safety. Associated health impacts include injuries, increased disease exposure and mental health effects from financial and emotional stress (Ahern et al., 2005). Remote communities are particularly vulnerable, as they often depend on limited essential services and vulnerable critical infrastructure for the distribution of food, medical supplies and other essential goods and services (see Sections 3.8 and 4.1).
Finally, there are also strong relationships between ecosystem impacts, whether caused by climate or other factors, on economic livelihoods (i.e. jobs, incomes) and community and population health (Hertzman et al., 1994; Raphael, 2001). Research in BC ’s coastal communities clearly links deteriorating ecosystem, economic and social conditions with health consequences (Ommer, 2007).
Adaptation
Awareness of climate change impacts on public health is growing, particularly in relation to increasing air pollution (BC Ministry of Health Services, 2004). Research networks on health are also growing (e.g. BC Environment and Occupational Health Research Network). There remains a need, however, for additional research on linkages between climate change and health impacts. In addition, co-ordination of disease surveillance with climate monitoring and environmental surveillance could provide important new insights.
Public health adaptation requires cross-sector approaches involving environmental managers, infrastructure developers, rural and urban planners, health care workers and administrators, public health educators, politicians and researchers. It also requires more information on prevention, protection and treatment of climate-related diseases (Parkinson and Butler, 2005) being made accessible to British Columbians.
8The website <http://www.env.gov.bc.ca/wsd/plan_protect_sustain/ groundwater/aquifers/index.html> [accessed April 30, 2007] provides information on aquifiers in British Columbia and a link to the Aquifier Classification Database.
Page details
- Date modified: