
Answer to question 7
A - 3, 4, 5
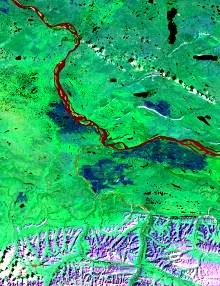
Satellite image: Mackenzie
River, N.W.T., LANDSAT TM
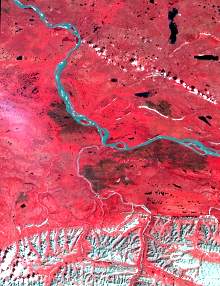
B - 3, 2, 1

Satellite image: Mackenzie
River, N.W.T., LANDSAT TM
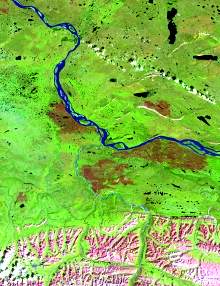
C - 4, 3, 2
Satellite image: Mackenzie
River, N.W.T., LANDSAT TM
D - 5, 4, 3
Satellite image: Mackenzie
River, N.W.T., LANDSAT TM
text version
Satellite images: Mackenzie River, N.W.T., LANDSAT TM
All four illustrations represent a Landsat-TM image of the Mackenzie River, NWT. The user is asked to identify which band combination is represented on each of the four colour images.
- Image A: The image has a predominant green component with red tones in the water bodies due to sediment.
- Image B: The color combination is very close to the natural colors.
- Image C: The image has a predominant red component notably in vegetated areas.
- Image D: The image has a predominant green component with some blue tones in the water bodies due to sediment.
Did You Know?
Each of these images (A, B, C, D) is made from the same TM data set. Only the band assignments differ.
Question:
What is the number of possibilities for selecting three different bands of the Landsat 5 Thematic Mapper's 7 available bands and coding them as the three primary colours?
Answer:
7 x 6 x 5 = 210 different combinations!
Page details
- Date modified: