
Hydrology Applications
The use of SAR for hydrology applications has a long history and has been extensively investigated for soil moisture estimation, snow mapping, and flood/wetland mapping. These applications have not realized operational or commercial success as of yet partly due to limitations of single channel SAR systems such as RADARSAT-1. Polarimetry has a potential to improve the use of SAR data for these applications helping to operationalize these applications. Some examples of this are provided in the following sections.
Soil moisture mapping
9.4.1.1 Introduction
Soil moisture is an important parameter for many natural resource applications such as hydrological modeling, stream flow forecasting, and flood forecasting. SAR data are well suited for estimating soil moisture due to the dependence of the dielectric constant on moisture at these frequencies. As described in the work of Dobson et al.![]() , for a given soil condition (roughness or texture) radar backscatter was found to be linearly dependent on volumetric moisture (mv ) in the upper 2 to 5 cm of soil with a correlation r
, for a given soil condition (roughness or texture) radar backscatter was found to be linearly dependent on volumetric moisture (mv ) in the upper 2 to 5 cm of soil with a correlation r ![]() 0.8 to 0.9 (
0.8 to 0.9 (![]() = A+Bmv) .
= A+Bmv) .
The presence of vegetative cover introduces another level of complexity to soil moisture mapping due to the interaction of the microwaves with the vegetation and soil. Depending on the amount of vegetation present, its dielectric properties, height and geometry (size, shape and orientation of its component parts) the sensitivity of microwave backscatter to volumetric soil moisture may be significantly reduced. The ability to effectively map soil moisture can be improved by judicious selection of imaging parameters such as incidence angle, wavelength and polarization.
Imaging at steep incidence angles is often chosen to minimize the contributions to backscatter of soil roughness and attenuation associated with above ground biomass. Backscatter is significantly affected by surface roughness at incidence angles beyond about 40°. Hence, imaging at lower incidence angles is recommended for soil moisture estimation.
C- Band in the HH polarization was found to be most sensitive to soil moisture and least sensitive to surface roughness in the presence of low biomass. In agricultural fields, as the vegetative component over the soil increases, longer wavelengths (e.g., L-band ) are needed to permit continued monitoring of soil moisture during the growing season ![]()
![]() . For shrubby or forest covered areas only longer wavelengths such as L-band or better yet P-band provide the penetration necessary for soil moisture estimation. Polarimetric data may help by reducing and/or accounting for the effects of roughness and/or vegetation on the soil moisture estimate.
. For shrubby or forest covered areas only longer wavelengths such as L-band or better yet P-band provide the penetration necessary for soil moisture estimation. Polarimetric data may help by reducing and/or accounting for the effects of roughness and/or vegetation on the soil moisture estimate.
9.4.1.2 Polarization dependence
The ability to estimate surface soil moisture (for depths from 0 to 2.5 cm) using various polarizations and polarimetric parameters of SIR-C data was reported in ![]() . The data were collected over bare soil surfaces in Southern Manitoba during April and October 1994. Evaluation of the polarimetric data was confined to data at incidence angles from 33 o to 38o. Polarimetric parameters examined included synthesized linear and circular polarizations, total power, Co- and Cross-polarization ratios, pedestal height, and Co-polarization Phase Differences (Table 9-1)
. The data were collected over bare soil surfaces in Southern Manitoba during April and October 1994. Evaluation of the polarimetric data was confined to data at incidence angles from 33 o to 38o. Polarimetric parameters examined included synthesized linear and circular polarizations, total power, Co- and Cross-polarization ratios, pedestal height, and Co-polarization Phase Differences (Table 9-1)
Data acquired in both the HH and VV polarizations were highly correlated with soil moisture (r = 0.86 - 0.87), whereas those at HV were more poorly correlated (r =0.71). Multiple regression analysis using various combinations of linear polarizations showed no significant improvement in soil moisture estimation.
The co- and cross polarization ratios were not as effective for soil moisture estimation as the data in HH or VV polarizations, although they have been used successfully elsewhere to help reduce the impacts of soil roughness and vegetation for data acquired at shallower incidence angles ![]() .
.
The mean Co-polarized Phase Difference (r = -0.35) was not significantly correlated to soil moisture. This parameter is often used to differentiate between scattering mechanisms, which in this case were relatively invariant and indicative of surface scattering (single bounce). Therefore, the low correlation was not unexpected.
The SIR-C data obtained in southern Manitoba show that information in the images at various polarizations and polarimetric parameters are highly inter-correlated (Table 9-2). Backscatter in HH, VV, and RL showed highest correlation with soil moisture.
Table 9-1. Correlation between radar backscatter and surface (0-2.5 cm) soil moisture (from ![]() ).
).
| C-Band Polarimetric Parameter | Correlation Coefficient (r) |
|---|---|
| Simple Linear Correlation Results | |
| HH Backscatter | 0.86* |
| VV Backscatter | 0.87* |
| HV Backscatter | 0.71* |
| Total Power | 0.87* |
| Co-Pol Ratio (HH/VV) | 0.53* |
| Cross-Pol Ratio (VV/HV) | -0.79* |
| Cross-Pol Ratio (HH/HV) | -0.74* |
| Co-Pol Pedestal Height | 0.82* |
| RL Backscatter | 0.88* |
| RR Backscatter | 0.68* |
| Co-Pol Phase Difference | -0.35 |
| Multiple Linear Correlation Results | |
| HH + VV | 0.87* |
| HH + HV | 0.86* |
| VV + HV | 0.87* |
| HH + VV + HV | 0.79* |
* statistically significant at p < 0.05
Table 9-2. Correlations between field averaged backscatter recorded for each linear and circular polarization on bare fields (from ![]() ).
).
| HH | VV | HV | Pedestal Height | RL | |
|---|---|---|---|---|---|
| VV | 0.99* | ||||
| HV | 0.86 | 0.86 | |||
| Pedestal Height | 0.94 | 0.92 | 0.94 | ||
| RL | 0.98 | 0.98 | 0.85 | 0.91 | |
| RR | 0.73 | 0.77 | 0.90 | 0.76 | 0.78 |
* correlation (r) coefficients
Examples of Co-polarization Signatures for backscatter from wet and dry soils are shown in Figure 9-13. It was found that for wet soils, where little penetration into the soil occurs, the intensity is highest in VV and the pedestal height is low (0.2) indicating a smooth surface with surface scattering predominating. For drier soils the maximum at VV is no longer present although the pedestal height is still 0.2 indicating a smooth surface. The increased microwave penetration of the soil under dry conditions accounts for the similarity of the responses in the HH and VV polarizations.

Figure 9-31
Figure 9-31. Co-polarization signatures from SIR-C data for, a) wet soils (30.5% moisture, surface roughness (rms) 17.4 mm) and, b) dry soil (17.7% moisture, surface roughness (rms) 13.2 mm (from ![]() ).
).
Snow mapping
9.4.2.1 Introduction
Estimation of snow cover and snow properties is important for input to hydrological applications such as modeling and forecasting runoff from snow melt as well as understanding changes in local, and regional climatic regimes. Typical snow parameters derived from radar data include, snow extent, snow water equivalence (SWE), and snow state (wet/dry).
The backscatter response from a snow covered surface is a function of numerous interrelated factors including the dielectric properties of snow, snow temperature, density, age, and snow structure. The backscatter received from a snow covered surface includes contributions from surface scattering at the air/snow interface, volume scattering from the snow layer, and scattering from the snow/ground interface. The extent to which backscatter is a function of surface scattering or volume scattering is governed by the properties of the snow. When a snow pack is dry (at a temperature less than 0°C) microwaves easily penetrate the snow (Figure 9-32) and the backscatter is largely a function of snow depth and snow density.
![]() = Penetration Depth (m) mv = Volumetric Liquid Water Content (percent)
= Penetration Depth (m) mv = Volumetric Liquid Water Content (percent)
Figure 9-32. Snow penetration depth as a function of liquid water content and microwave frequency (from ![]() ).
).
Depending on the microwave frequency and snow depth, backscatter from a dry snow pack may largely be a function of the ground surface characteristics underlying the snow pack due to the relative transparency of dry snow at microwave frequencies.
At C-band, wet snow is an absorber and dry snow is transparent making the estimation of SWE difficult. Polarimetry may help by providing additional information about the snow pack helping to improve the SWE estimate.
9.4.2.2 Polarimetric signatures
One study [![]() ] used the C-SAR on the Environment Canada CV-580 to investigate the polarimetric properties of a snow pack. Figure 9-33 shows snow pit profiles for 4 dates during the winters of 1997-1998 and 1998-1999. Figure 9-34 shows Co-polarization Signatures derived from the C-SAR data for these sites on these 4 dates. It can be seen that on the wet snow date, March 6, the signature is indicative of a smooth surface pedestal height = 0.2) with little polarization dependence.
] used the C-SAR on the Environment Canada CV-580 to investigate the polarimetric properties of a snow pack. Figure 9-33 shows snow pit profiles for 4 dates during the winters of 1997-1998 and 1998-1999. Figure 9-34 shows Co-polarization Signatures derived from the C-SAR data for these sites on these 4 dates. It can be seen that on the wet snow date, March 6, the signature is indicative of a smooth surface pedestal height = 0.2) with little polarization dependence.
Figure 9-33. Snow pit profiles for 4 dates (From ![]() ).
).
The polarization signature for the Dry Snow (December 1, 1997) shows a polarization signature with a higher pedestal (0.4) due to the penetration to the ground surface, which is rougher. In this case, the peak at the VV polarization is indicative of surface scattering. As the snow pack develops and horizontal ice layers form within it, the polarization signature changes (as seen on March 12, 1998). The surface appears rougher with a pedestal height of 0.6. Significant backscatter is seen to occur at the HH and VV polarizations. The polarization signature is significantly different on March 9, 1999 where significant backscatter is seen in the HH polarization with much less at VV.
These examples show that the polarimetric signatures make it possible to extract more information from imagery of the snow-pack. It is not yet clear how this might improve SWE estimation.
|
|
|
|
|
|
|
|
|
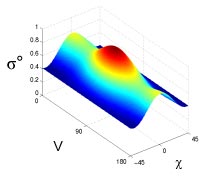
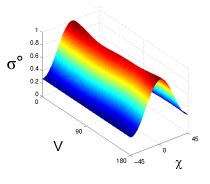
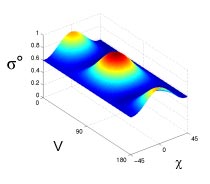
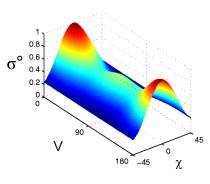
Figure 9-34. C-Band Co-polarization plots for selected snow packs derived from data acquired by the C-SAR on the Environment Canada CV-580 (from ![]() ).
).
Answer: The wetlands typically have vertically structured plants like rushes and sedges which can be separated using a combination of VV and HH responses. The cross-polarization can also help in delineating water from vegetated targets, especially under windy conditions during data acquisition.
Flood/wetland mapping
9.4.3.1 Introduction
SAR imagery has proven to be very useful for flood mapping and for wetland vegetation classification. The dark returns from water contrast with the brighter ones from land and flooded vegetation thus making it possible to identify open flooded areas. This makes possible the determination of the extent of the flood although problems can occur when attempting to map flooded vegetation. Wetland vegetation also has a variety of shapes, sizes, and distributions, which can be used for discrimination between vegetation types. The use of multi-temporal SAR data has been shown to be useful for wetland classification due to the seasonal changes in vegetation and water levels which affect the microwave backscatter. Polarimetric SAR data can be used to improve extraction of information for these applications.
9.4.3.2 Flooded areas

Did you Know?
Wetlands are a key part of the ecosystem for maintaining both water quality and quantity. They are also prime breeding locations and thus are critical components for maintaining ecosystem health.
Figures 9-35 to 9-37 show various C-band images acquired by SIR-C of the Red River flood in 1994. There is a significant improvement in the mapping of the flooded regions using the HV image on April 11 compared to the HH image where most of the flooded area is delineated and the VV image where identification of the flooded region is difficult. On April 12, there is little such difference between images in the different polarizations. On April 16, the HH and HV images are very similar. These relative changes between images in the different linear polarizations show the value in the use of imagery in the various polarizations for flood mapping.

Figure 9-35
Figure 9-35. Linearly Polarized SIR-C C-Band images acquired on April 11, 1994 of the Red River, Manitoba (from  ).
).

Figure 9-36
Figure 9-36. Linearly Polarized SIR-C C-Band images acquired on April 12, 1994 of the Red River, Manitoba. (from ).

Figure 9-37
Figure 9-37. Linearly Polarized SIR-C C-Band images acquired on April 16, 1994 of the Red River, Manitoba (from ![]() ).
).
9.4.3.3 Wetlands
The use of imagery in multiple polarizations has been found to improve wetland classification when compared to the use of single channel data alone. Two classes may be confused in imagery of a particular polarization but separable in imagery at other polarizations. This is especially true for wetlands which have a mix of vertically oriented plants such as sedges, rushes, and grasses interspersed with shrubs and trees, which have a more random distribution of vegetative components.
An example C-SAR image of an area in the valley of the St. Lawrence River showing several classified wetlands is shown in Figure 9-38.
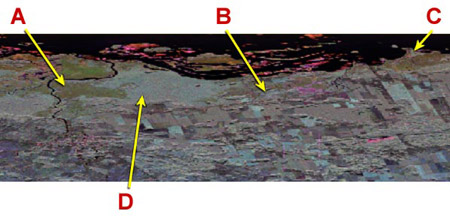
Figure 9-38a

Figure 9-38b
A = Marsh
B = Woody Marsh
C = Shrubby / Herbaceous swamp
D = Marsh / shrubby Swamp
E = Wooded Bog
Figure 9-38. False colour composite of C-SAR imagery acquired September 1, 1997 showing several wetland classes along the St. Lawrence River, Ontario: Red: HH; Green:HV Blue: VV. Courtesy of CCRS.
Page details
- Date modified: