
Sea Ice Applications
Synthetic Aperture Radar imagery is well suited to Sea Ice mapping and monitoring applications. This was a significant driver for the development of RADARSAT-1. RADARSAT-1 is used operationally by Canada as well as several other countries for the mapping and monitoring of sea-ice.
However, data from single-channel SARs, such as the one on RADARSAT-1, are limited in their application to sea ice monitoring especially outside of cold winter conditions and in marginal ice zones. Interpretation and analysis difficulties include the ambiguity between water and ice at low incidence angles and/or in high wind conditions, confusion between water and thin ice, masking of ice signatures under wet (spring) conditions, and ice type identification. The following sections illustrate how polarimetric SARs can provide additional information for addressing these difficulties in interpretation and analysis.
Ice structure and type
Polarization signatures generated from the scattering matrix can be used to interpret the scattering properties of the target helping to understand the roughness, polarization dependence, and scattering mechanisms for that ice type. Figure 9-20 shows C-band co-polarization signatures for smooth first year ice with varying snow cover and for young and ridged ice. Note, there is less of a peak at VV for the ridged ice due to roughness effects and the reduced polarization dependence in the ice. This is partly due to plates of thin ice layers in the snow giving rise to differential HH and VV responses.
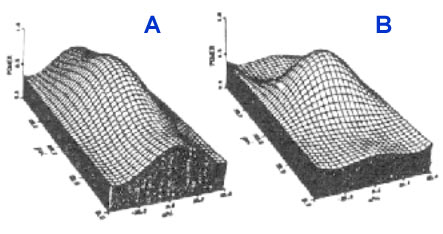
Figure 9-20. C-band Co-polarization signatures for a) young and ridged ice and b) for smooth first year ice with different snow cover properties (from  ).
).
The use of polarization signatures for ice type interpretation can also be demonstrated by comparing signatures for new, grey, rough grey, and desalinated sea ice types which represent a time series in terms of evolution and development. Figure 9-21 shows these polarization signatures and demonstrates the migration of the peak response from HH to VV which is related to the reduction in the dielectric constant of the ice surface over this time period. It is noted that the polarization response changes once again towards an HH peak as the ice further evolves, becomes rougher and desalinated.
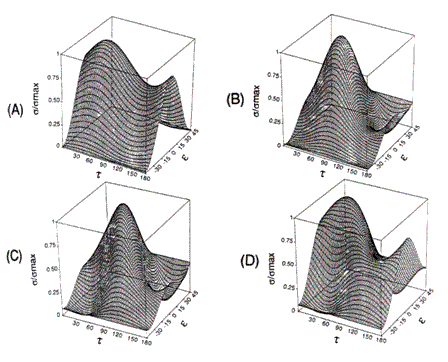
Figure 9-21. Co-polarization C-band signatures of new, grey, rough grey, and desalinated sea ice types from scatterometer measurements. Note the change in the peak polarization response as the ice ages from new to desalinated ice types (from ).
Ice-water ambiguity
At steep incidence angles, especially under high wind conditions, confusion can often occur between open water and sea ice in imagery acquired by single channel SARs such as RADARSAT-1 or ERS1/2. Imagery from multi-polarization SARs can be used to greatly reduce this confusion in two different ways: Due to the minimal backscatter from the water in the cross-polarization (HV or VH), imagery acquired at these polarizations can be used to improve discrimination between the water/ice/land classes: The land and to some degree the ice both experience volume scattering giving rise to a cross-polarized return Figure 9-15 illustrates this for the same area of the Labrador Sea as shown in Figure 9-14.
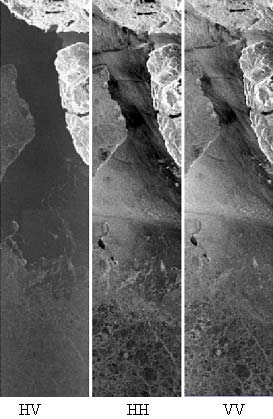
Figure 9-15. Single channel intensity C-band images from SIR-C of the Labrador Sea illustrating the improved contrast of the first-year ice/water boundary of the HV channel due to a lack of multiple scattering from the water surface (from ).
Figure 9-16 demonstrates how a ratio of HH /VV can be used to achieve similar results as the different scattering characteristics of the two targets at HH and VV can be used to improve the contrast compared to any single channel.
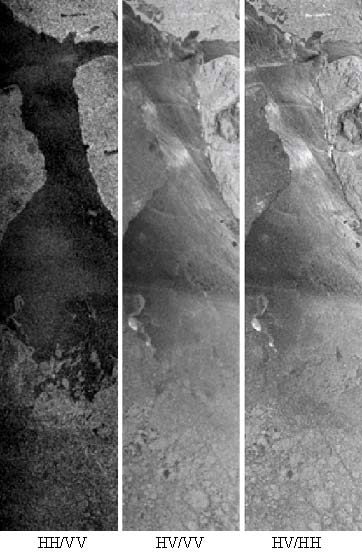
Figure 9-16. Ratios between images of Labrador Sea acquired by SIR-C show the advantages of the co-polarization ratio for improving the contrast of the first-year ice/water boundary (from ).
Polarimetric decomposition techniques can be used to generate polarimetric discriminators that can be used to aid interpretation or to use for classification. Figures 9-17 and 9-18 show examples of the contrast between ice and water that is visible in C- and L-band images with particular improvements visible in the use of anisotropy at C-band and the entropy at L-band.
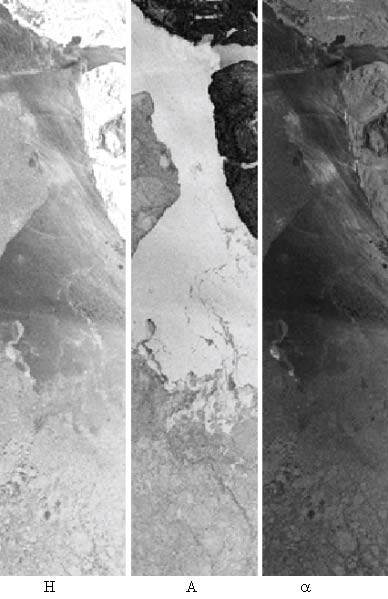
Figure 9-17. C-band entropy (H), anisotropy (A), and alpha-angle ( ) images for the Labrador Sea demonstrating the improved contrast of ice/water using the anisotropy parameter (from ).
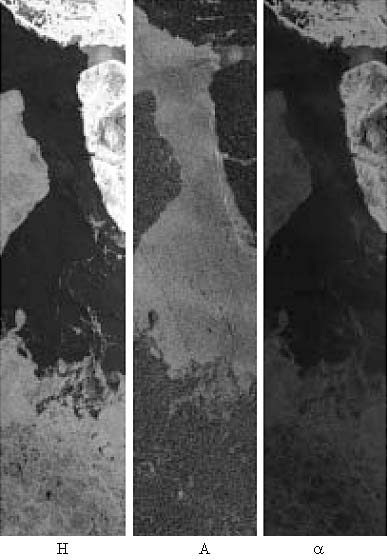
Figure 9-18. L-band entropy (H), anisotropy (A), and alpha-angle () images for the Labrador Sea demonstrating the improved contrast of ice/water using the entropy parameter (from ).
Polarimetricanalyses for sea-ice
Polarimetric SAR data can be used to create a variety of output products including multi-polarization intensity images as well as polarimetric parameters. Images acquired with the various combinations of polarizations on transmit and receive can be displayed on single channels or in various combinations including ratios and false colour composites. Figure 9-14 shows images acquired in each of the three linear polarizations as single channel intensity images and combined into a false colour composite. The imaged areas is in the Labrador Sea off the coast of Newfoundland with ice and open water.
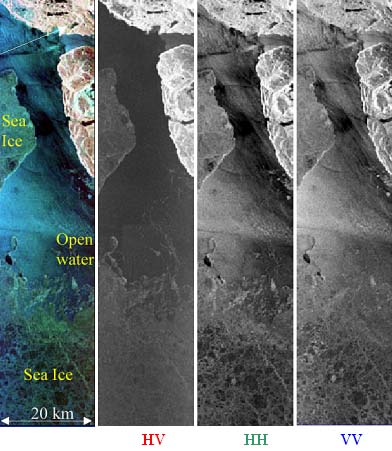
Figure 9-14. C-band false colour composite and single channel intensity images from SIR-C for an ice infested region of the Labrador Sea off the coast of newfoundland. The data were acquired on April 18, 1994 with incidence angles ranging from 26 to 31 degrees. (from ![]() )
)
The complex data can also be used to generate polarimetric signatures as well as polarimetric parameters which can be used to aid in interpretation and understanding of the scattering mechanisms. Polarimetric discriminants can also be generated and used for classification purposes. The following material illustrates these approaches for sea ice applications.
Sea ice classification
The ability to perform robust and unambiguous ice type classification is critically important for operational applications and is one of the limitations of single channel SARs. Polarimetric SARs offer the potential of improved classification accuracy due to the increased information content of the additional polarizations and the phase data. Sea-ice classification methodologies for polarimetric SAR's are being developed and the results are demonstrating improved separability with the polarimetric response at both C- and L-bands. An example for C-band data acquired by the CV-580 off PEI in March 2001, is provided in Figure 22. It was found that while the multi-polarization data provided better class separability than single polarization data the fully polarimetric data provided enough information to provide an effective classification of the ice types.
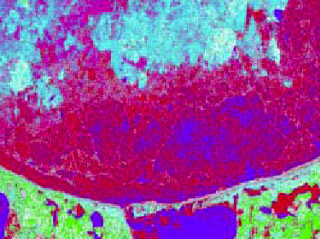
Figure 9-22 |
|
| Colour Assignment | |
|---|---|
| Colours | Description |
| blue | Smooth, thin Fast Ice |
| red | Fast Ice with rough surface |
| magenta | Rough RYI |
| cyan | Rough, thicker FYI |
| white | Rough, thicker FYI / Land |
| green | Land |
| dark green | Land |
| black | Land |
| grey | Classes not used for comparison in the scatterplots (white dark green and black) |
Figure 9-22. Classified image of the north shore of PEI using CV-580 polarimetric C-band SAR data using a complex Wishart classifier with 8 initial classes and 12 iterations (from ).
Polarimetric decomposition was used to illustrate the extra information content of the polarimetric data. Figure 9-23 shows the Entropy (H), Anisotropy (A), and Alpha( )-Angle for these data. The bottom image shows land, while fast ice is highlighted in the central image and rough first-year ice in the top image. Smooth ice shows the lowest entropy due to homogenous scattering whereas land has higher entropy. The anisotropy is lower for land and higher for ice providing the best contrast for land/ice and between ice types. The alpha-angle is low for smooth ice, which along with low entropy demonstrates surface scattering dominates. For rougher first year ice both the alpha angle and entropy are higher which, as demonstrated in the cross-polarization channel, indicates that more volume scattering is occurring.
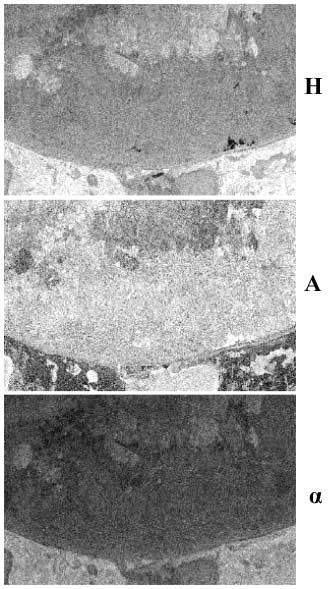
Figure 9-23
Figure 9-23. Entropy (H), Anisotropy (A), and Alpha ()-Angle for images from C-band data acquired with the CV-580 off the North shore area of PEI in March, 2001. The bottom image shows land, while fast ice is highlighted in the centre image and rough first-year ice in the top image (from ).

Did you Know?
Arctic sea ice data for 1953-1998 indicate that 6 of the 10 years of smallest ice extent have occurred since 1990, with increased regional variability in recent years. Summer 1998 was particularly unusual:. Open water formed earlier than in prior years, and the ice extent in September was 25 percent smaller than during the previous record minimum.
The use of fully polarimetric multi-frequency SAR such as the JPL AIRSAR is very attractive because the additional frequencies allow more target information to be extracted. For example the varying penetration characteristics allow further separability between ice types especially among multi-year ice types and first-year ice types. This can be illustrated by the use of multi-frequency polarimetric decomposition techniques to identify surface versus volume scattering target characteristics. Figure 9-24 shows the classification of surface versus volume scattering using this technique while Figure 9-25 provides the classification results. Future spaceborne SAR systems are planned at both C- and L-band which are expected to make multi-frequency polarimetric SAR imagery available in the not too distant future.
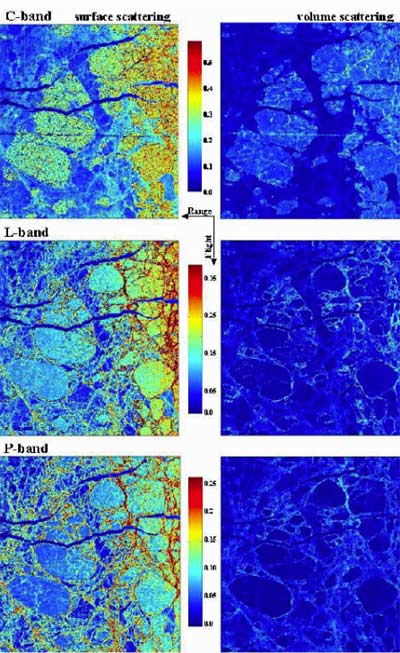
Figure 9-24
Figure 9-24. Total power images of the Freeman-Durden decomposition of C-L, and P-band AIRSAR data showing surface versus volume scattering (from ).
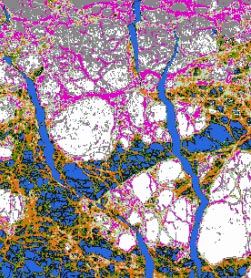
Figure 9-25 |
||
| Class Assignment To Ice Types | ||
|---|---|---|
| Class | Colours | Description |
| ThI / SFYI | blue | new forming thin ice / Smooth first year ice |
| RFYI / R | orange green black |
Ridged first year ice / Rubble |
| CFYI | pink pastell green |
Compressed First Year Ice |
| MYI | white grey |
Multi Year Ice |
Figure 9-25. Ice type classification results using data acquired by the JLP AIRSAR. An entropy based polarimetric decomposition using eight classes and 12 iterations (from ).
Whiz quiz

Question: What is the difference in scattering mechanism between new ice and multi-year ice? How would you use polarimetry to determine this? The answer is...
Whiz quiz - answer
Answer: New ice is dominated by surface scattering whereas multi-year ice has a large volume scattering component. The pedestal height would indicate the degree of roughness, the HV would help identify volume scattering and the polarimetric classification of scattering mechanisms could be used to determine areas of volume scattering.
Page details
- Date modified: