
The UTM Grid - Rectangular Grid References
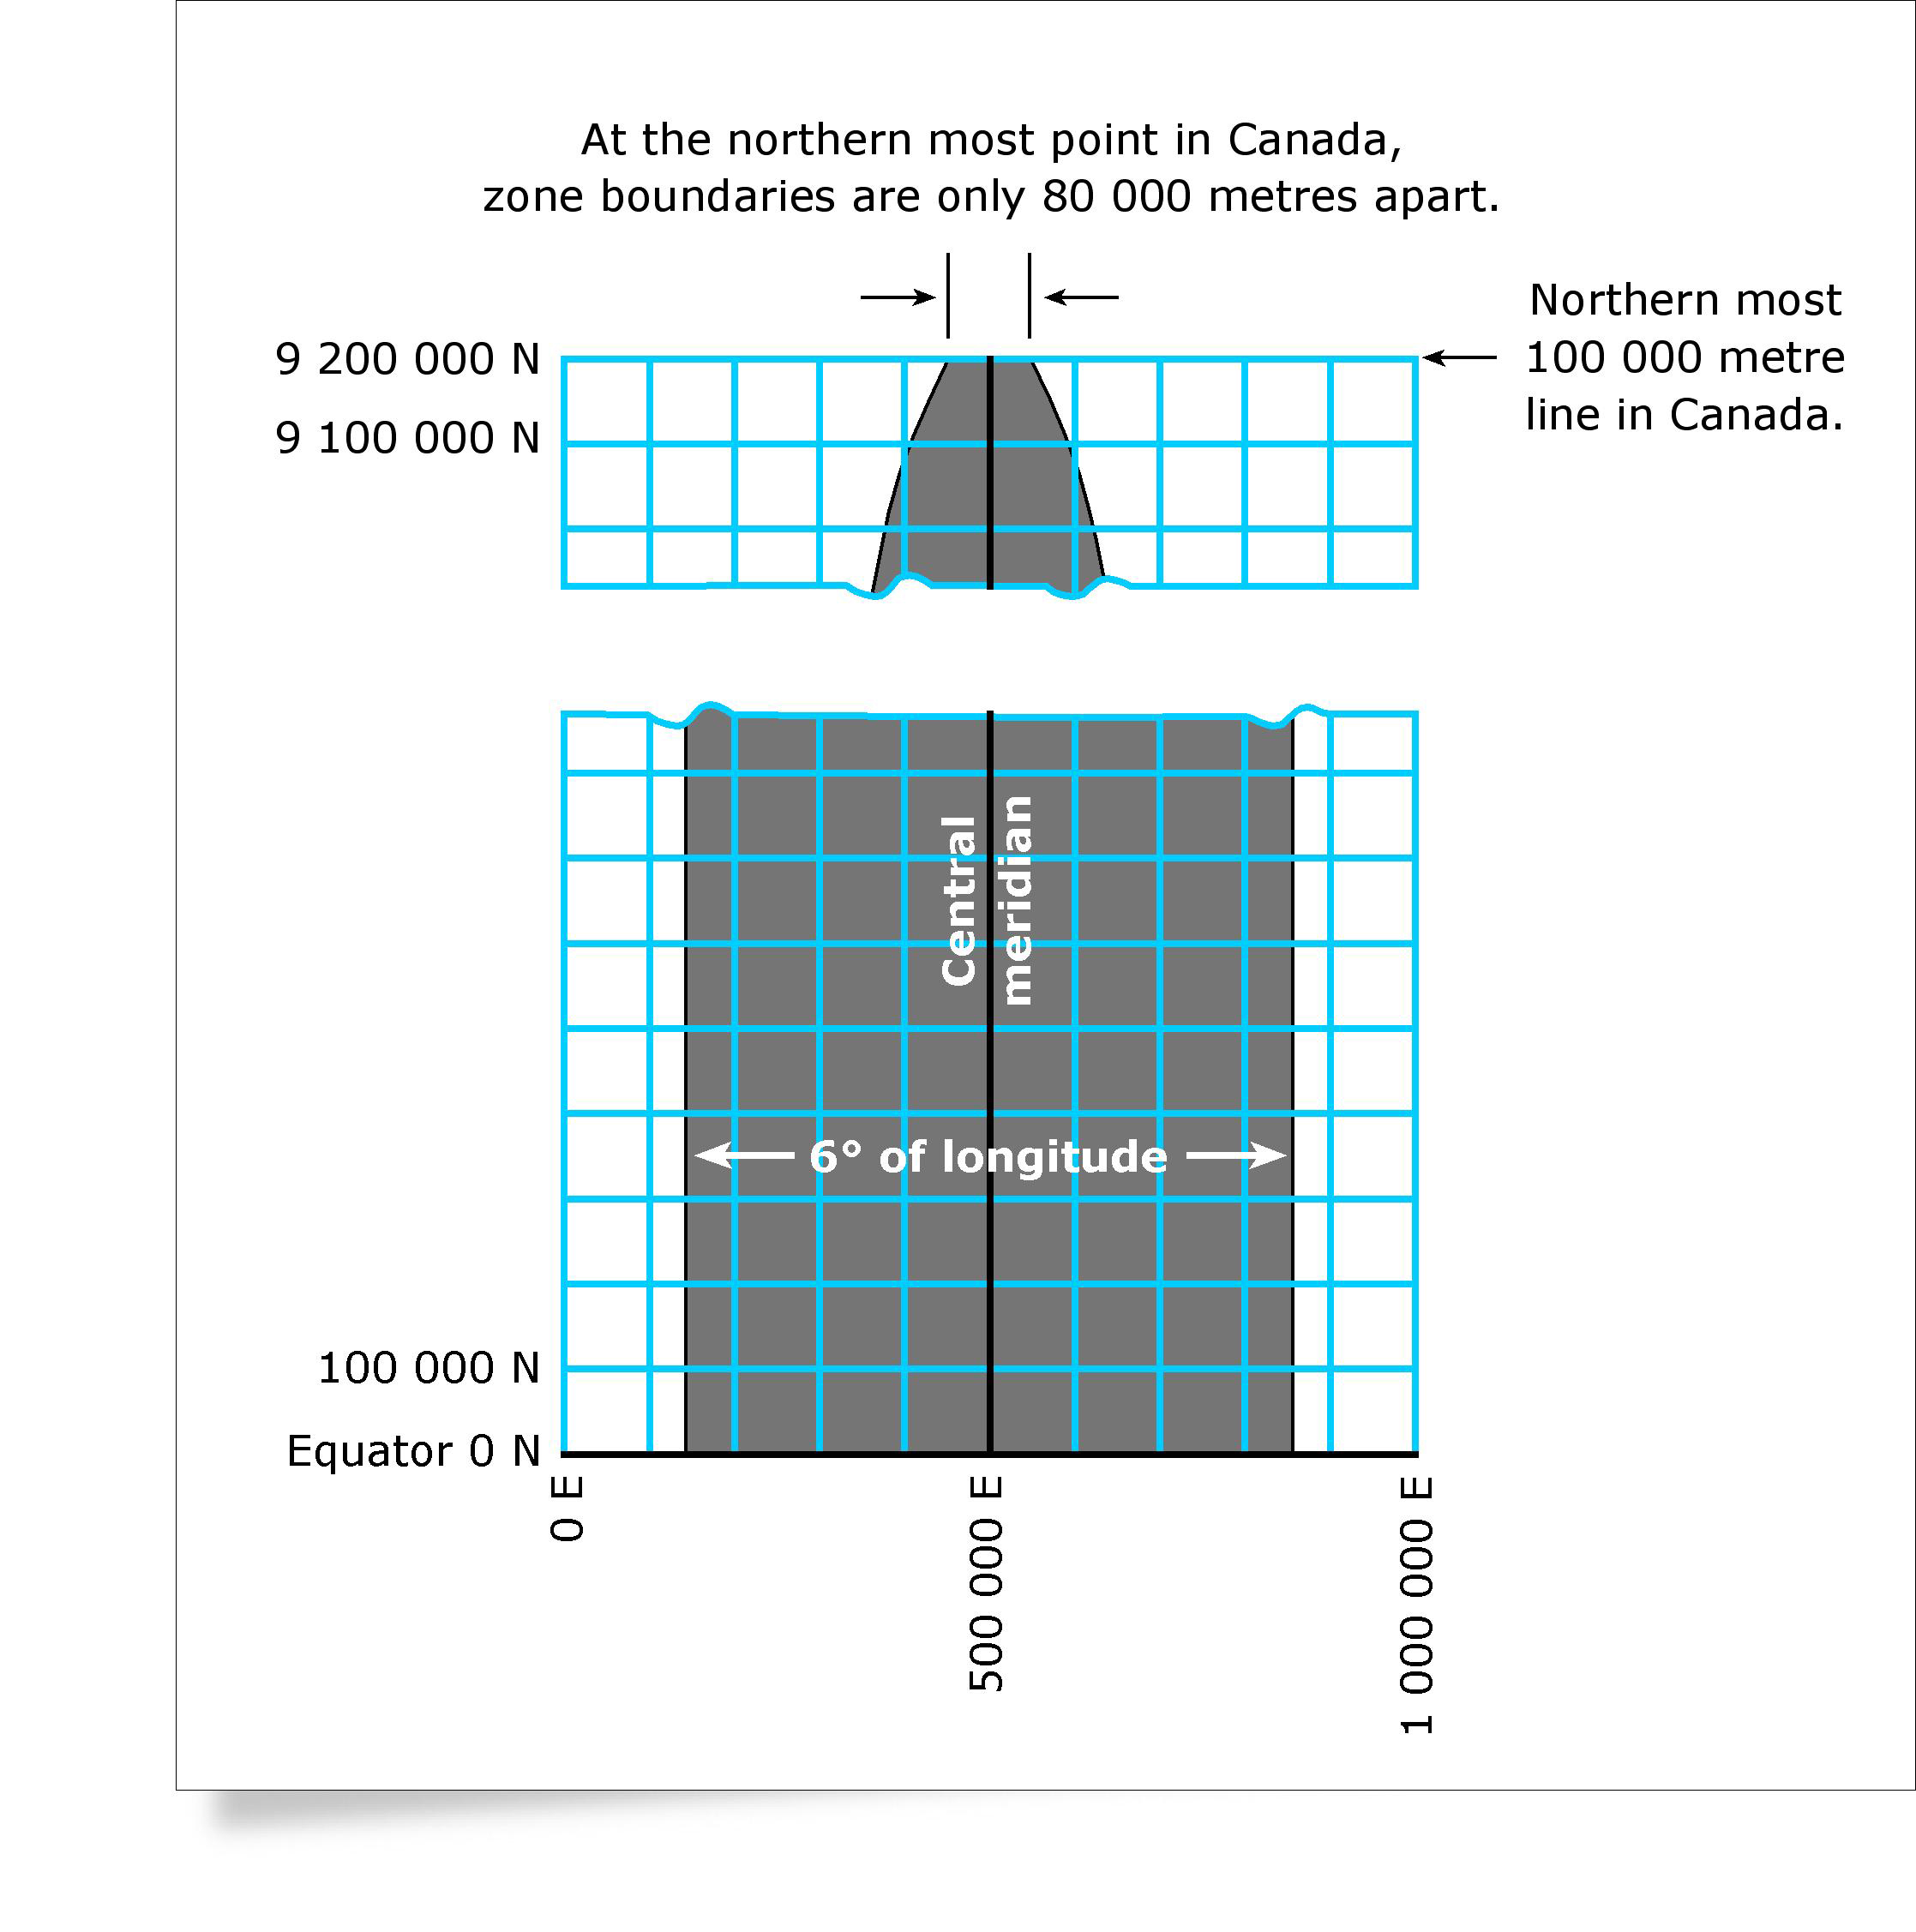
Figure 1
Text Version
Figure 1
Figure 1 is an illustration of the 100,000 metre UTM rectangular grid superimposed over a UTM zone. This diagram shows how the width of the UTM zone changes as compared to constant dimensions of the UTM grid. For the UTM grid, basic grid lines are 100,000 metres apart. Vertical lines of the UTM grid are parallel to the central meridian of the UTM zone and the horizontal lines of the UTM grid are parallel to the equator. A UTM zone has a width of 6 degrees of longitude where its maximum width, in distance, is at the equator and its minimum width (zero) is at the North Pole. At the equator, the width of the UTM zone is approximately 1,000,000 metres. However, due to the divergence of the lines of longitude of the UTM zone from the UTM grid, the width of the zone at northernmost 100,000 metre horizontal grid line (9,200,000 North) is only 80,000 metres.
At one time or another, most of us have used a city map to find the location of a street. Such maps are usually divided by vertical and horizontal grid lines. The grid spaces formed by these lines are designated along one margin by letters and along the other by numbers. A combination of letters and numbers, such as "B-7", indicates the square formed by the intersection of column B and row 7; it is here that the desired street is to be found.
This system works fairly well for city and road maps, where the names of streets, cities, etc., are clearly printed. For most topographic maps, however, many of whose features bear no name, such a system would not be sufficiently precise. A petroleum engineer, for example, who wishes to describe the location of an oil well on a flat piece of prairie would hardly be satisfied with saying that it is located somewhere within an area covering 25 square kilometres. Military tacticians also need a more exact system of pin-pointing places on maps. It was requirements such as these which led to the development of the rectangular map grid.
System Description
This grid uses as its basic element of identification not squares, as the city map does, but lines. These lines are standard on all UTM maps. Because they are drawn on our "orange strips" after the strips have been flattened, the grid lines are perfectly straight and undistorted. The basic grid lines, both horizontal and vertical, are drawn 100 000 metres (100 km, or about 62 miles) apart.
All vertical lines run parallel to the central meridian of each zone, i.e., the meridian that runs down the centre of each zone exactly three degrees of longitude from either side. All horizontal lines run parallel to the equator (See Figure 1). It must be borne in mind here that the parallels of latitude shown on our UTM maps are not parallel to the equator, or to each other, because they are slightly distorted by the flattening. The equator itself is not distorted by the Transverse Mercator projection.
At one time or another, most of us have used a city map to find the location of a street. Such maps are usually divided by vertical and horizontal grid lines. The grid spaces formed by these lines are designated along one margin by letters and along the other by numbers. A combination of letters and numbers, such as "B-7", indicates the square formed by the intersection of column B and row 7; it is here that the desired street is to be found.
The squares formed by the intersection of the 100 000-metre lines are almost always further subdivided by 10 000-metre lines, 1 000-metre lines, and even 100-metre lines, depending on the scale and purpose of the map. Most maps show less than the width of a UTM zone, but information relating the map to the zone and defining the grid spacing, is always provided on the margin, for example:
ONE THOUSAND METRE UNIVERSAL TRANSVERSE MERCATOR, GRID ZONE 17
The beauty of the UTM rectangular grid is that by using a brief code consisting of zone and grid-line numbers it is possible to identify any point in Canada, even if that point is not otherwise marked or identified on any map. Two systems are marked on NTS maps for identifying points with reference to the rectangular grid.
To help you understand what topographic maps are and how to use them, see National Topographic System (NTS) and The basics (PDF, 1.34 MB).
This material updated from The Universal Transverse Mercator Grid, Department of Energy, Mines and Resources Canada, Surveys and Mapping Branch, Ottawa, © 1969, The Queen's Printer.
Find out more
Page details
- Date modified: