
(Published in April 2026)
Mineral exploration plays a key role in ensuring the long-term viability of Canada’s mining industry. Through exploration activities, new mineral deposits are identified and evaluated that may eventually become mines supplying the minerals and metals used in a wide range of products and technologies. However, only a small proportion of deposits ultimately advance to become mines. These deposits are often located in remote and northern regions, where the development of new mining projects can generate employment, infrastructure investment and economic opportunities for surrounding communities.
Learn about the latest trends in mineral exploration in Canada:
Overview
Spending intentions for 2026 indicate a significant expansion in exploration and deposit appraisalFootnote 1 expenditures, with planned spending rising 21% to $5.3 billion, which would represent a new high if realized. The increase is largely driven by exploration targeting gold, as record gold prices are generating heightened interest and investment. Preliminary data show that expenditures increased 4% in 2025 to $4.4 billion, following stable spending of $4.2 billion in 2024.
Earlier in the decade, exploration spending rebounded strongly after declining in 2020 amid COVID-19 pandemic-related disruptions. Expenditures rose 73% in 2021 to $3.8 billion and continued to increase in 2022, reaching $4.4 billion—the highest level on record at the time. Spending moderated slightly in 2023 to $4.2 billion as tighter financial conditions, moderating metal prices and broader macroeconomic uncertainty weighed on investment decisions.
Figure 1. Expenditures by company type, global spending and price indices, 2017 to 2026
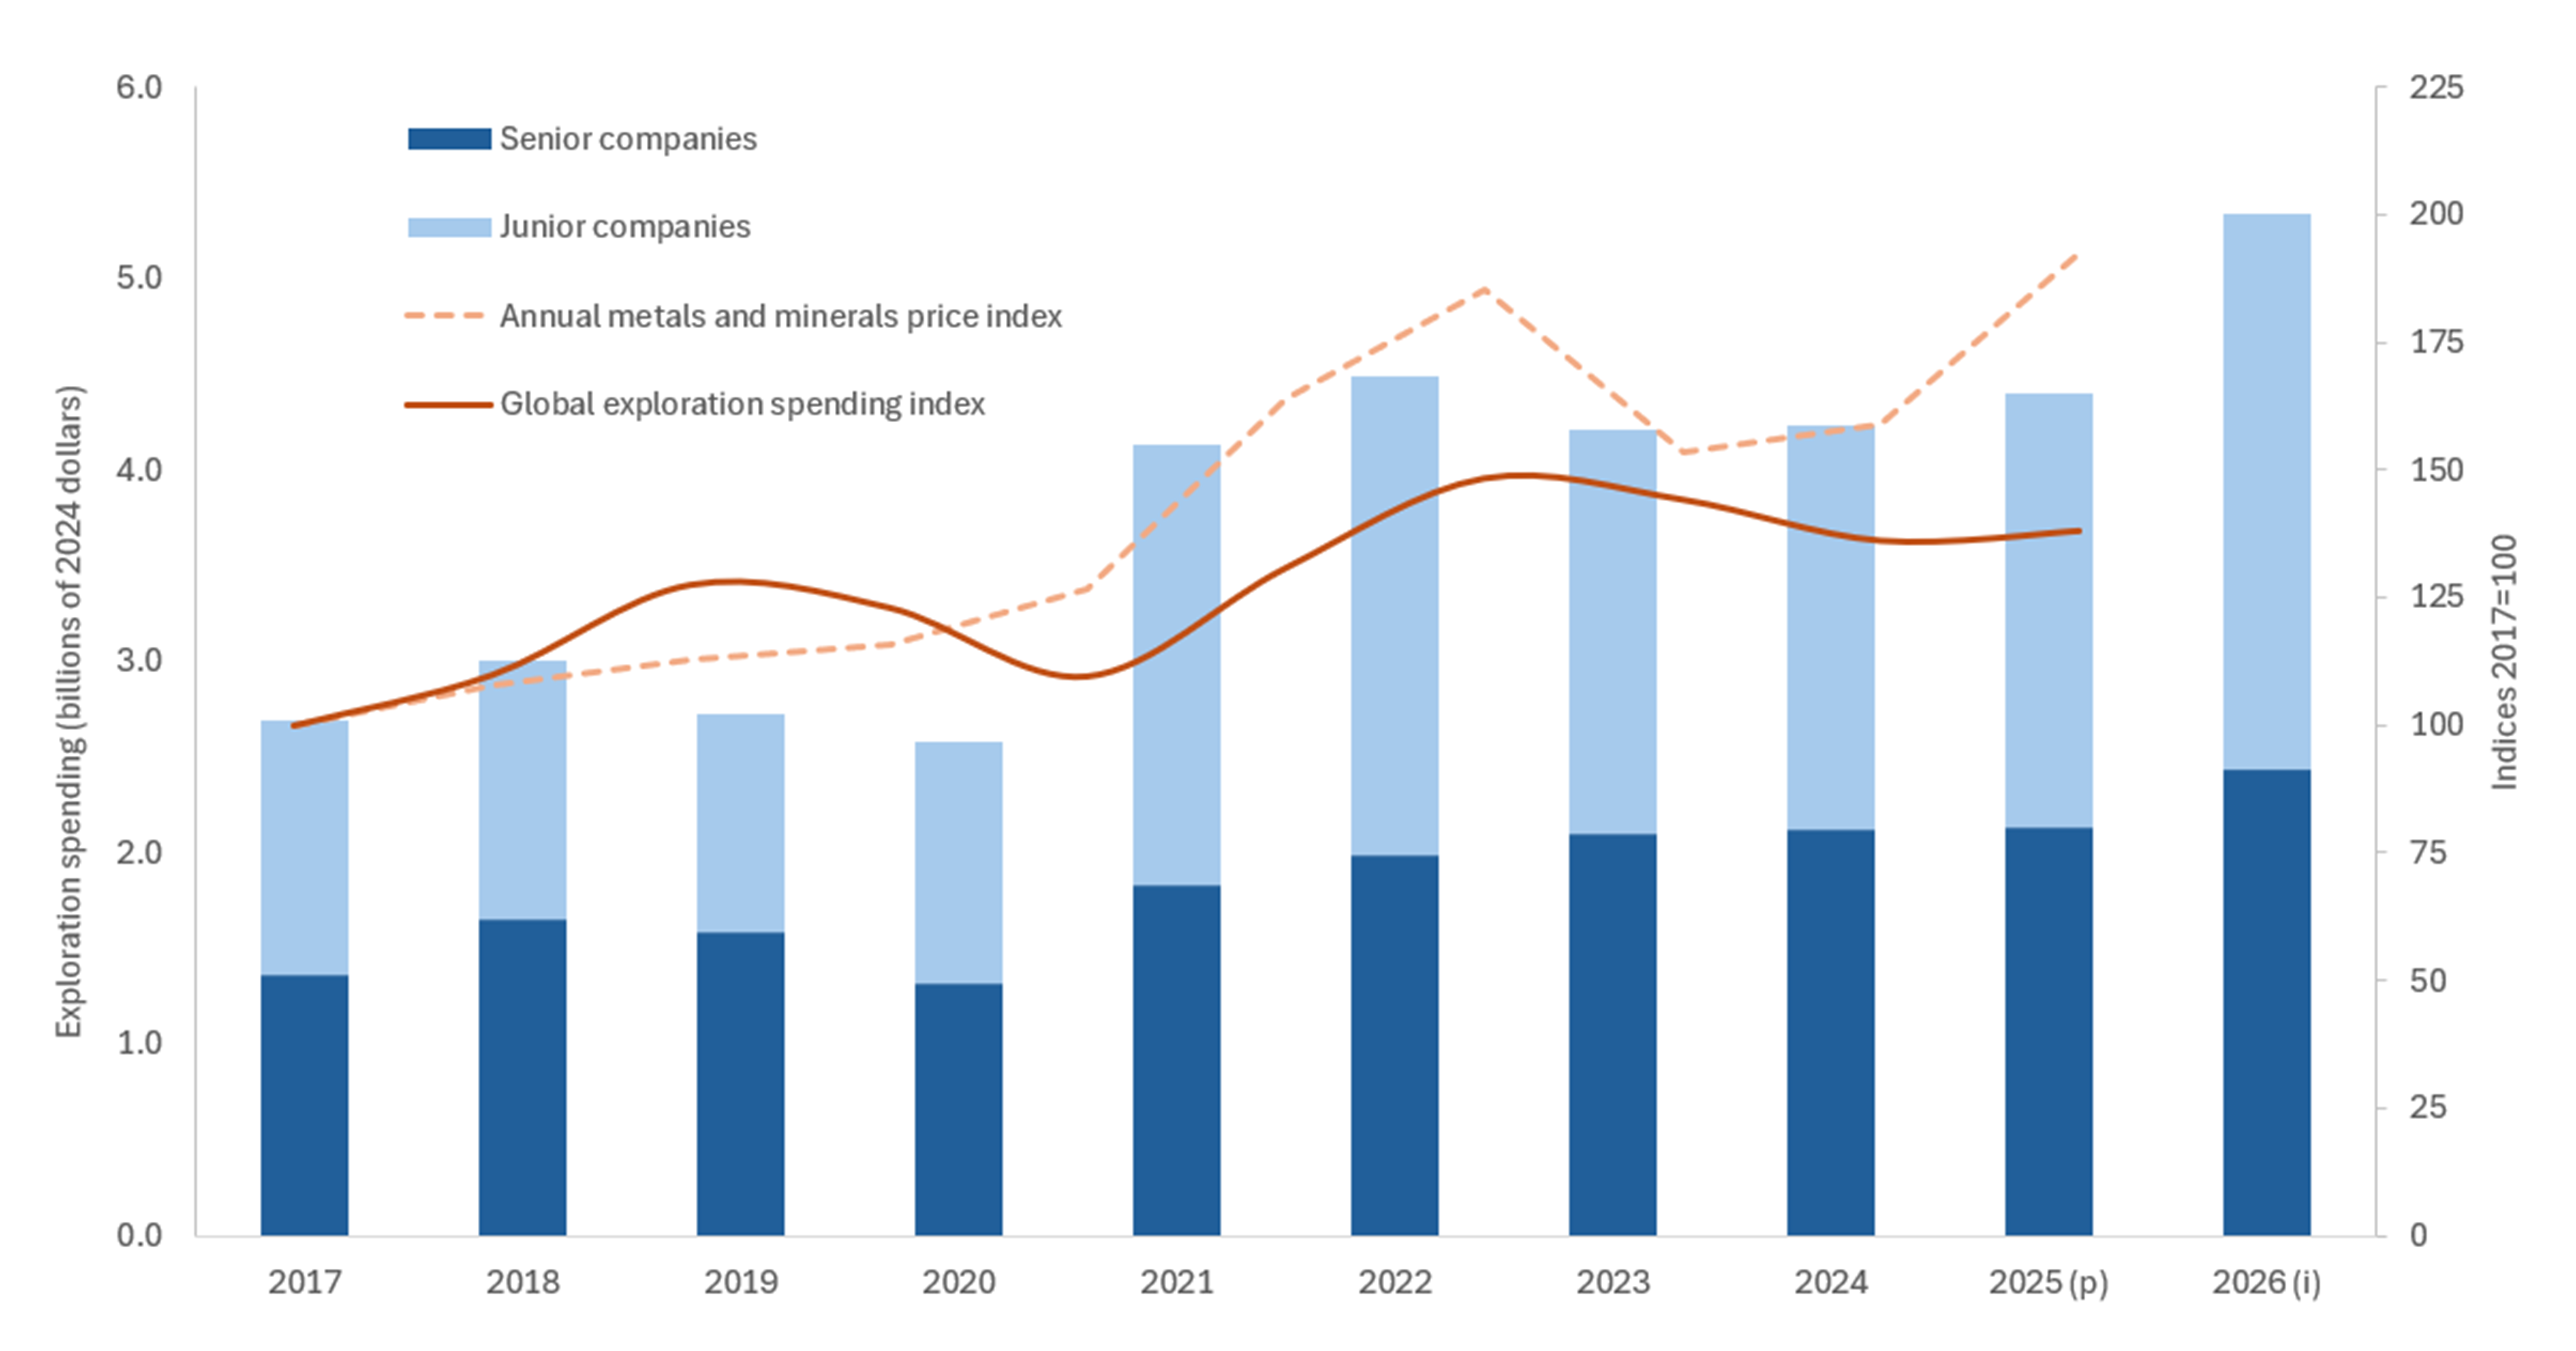
Sources: Natural Resources Canada, Institut de la statistique du Québec, Bank of Canada, S&P Global Market Intelligence
p = preliminary expenditures, i = spending intentions
Figure 1 — Text version
This bar chart shows exploration and deposit appraisal expenditures by type of company from 2017 to 2026. Each bar is divided into two segments representing senior and junior companies. A line graph depicting the Bank of Canada’s metals and minerals price index is superimposed over the bar graph, along with a second line showing the global exploration spending index. The chart illustrates the strong historical relationship between metal and mineral prices and exploration spending.
The evolution of exploration spending over the past decade reflects broader global economic and commodity market cycles. Metal and mineral prices reached a cyclical peak in the early 2010s, fueled by rapid economic expansion in China and other emerging markets. Prices subsequently declined as supply outpaced demand before beginning a recovery in 2016. This recovery continued through 2019 before being disrupted by pandemic-related economic shutdowns in early 2020. Prices rebounded later in 2020 and climbed through early 2022—particularly for base metals and battery minerals—before moderating in 2023. Through 2024 and 2025, prices stabilized at levels that remain elevated compared with pre-pandemic averages, sustaining exploration interest across multiple mineral groups.
Gold remains the leading exploration target in Canada. Over the past several years, gold prices have reached successive record or near-record levels, driven by persistent geopolitical uncertainty, strong safe-haven investment demand and sustained central bank purchases. These conditions have helped sustain exploration spending in Canada’s precious metals sector, particularly among junior exploration companies.
Long-term demand expectations associated with the clean energy transition continue to influence exploration strategies. Global commitments toward net-zero emissions are expected to require substantial quantities of minerals and metals used in electric vehicles, renewable energy systems, energy storage technologies and electricity transmission networks. According to the International Energy Agency, demand for several critical minerals could increase multiple times by 2040 under energy transition scenarios.
Copper, in particular, plays a central role in electrification because of its use in transmission infrastructure, renewable energy systems and electric vehicles. Ongoing concerns about future supply-demand balances have supported exploration interest in base metals, including copper and nickel.
Beyond the energy transition, rapid growth in data centres, driven in part by artificial intelligence (AI), has emerged as a significant new source of electricity demand. Projections indicate that electricity consumption from data centres could rise substantially over the remainder of the decade, reinforcing the need for expanded power generation and electricity networks.
This growing electricity demand strengthens the medium- to long-term outlook for metals associated with electrical infrastructure and industrial capacity, contributing to continued exploration interest in base and critical minerals.
In addition to energy and digital infrastructure, growing defence and security requirements are also influencing long-term demand for several minerals and metals. Rising geopolitical tensions and increased defence spending among many advanced economies have renewed focus on secure supply chains for materials used in military equipment, aerospace systems and advanced technologies. Metals such as nickel, copper, rare earth elements and titanium are used in applications ranging from aircraft and naval vessels to precision-guided systems, communications equipment and advanced electronics. These considerations have reinforced interest in diversifying and strengthening mineral supply among allied countries, contributing to exploration interest in a range of base and critical minerals.
Together, these structural demand drivers—energy transition, electrification, AI infrastructure expansion, evolving defence and security needs and sustained gold investment demand—are shaping expectations for future mineral demand. These factors provide important context for the stability observed in 2024 and 2025 and the stronger spending intentions reported for 2026. Canada remains one of the world’s leading destinations for mineral exploration investment, accounting for nearly one fifth of global exploration expenditures and possessing significant mineral resources that can support future supply.
Although nominal exploration spending remains historically high, inflation has reduced the real purchasing power of exploration budgets. Canada’s consumer price index rose 6.8% in 2022 and 3.9% in 2023 before easing to 2.4% in 2024 and 2.1% in 2025. Elevated operating and development costs have reduced the effective purchasing power of exploration expenditures.
When adjusted for inflation, exploration spending in constant 2006 dollars remains below its 2011 peak despite recent nominal highs, highlighting the cumulative impact of rising costs on exploration activity.
Figure 2. Exploration spending and inflation, 2006 to 2025
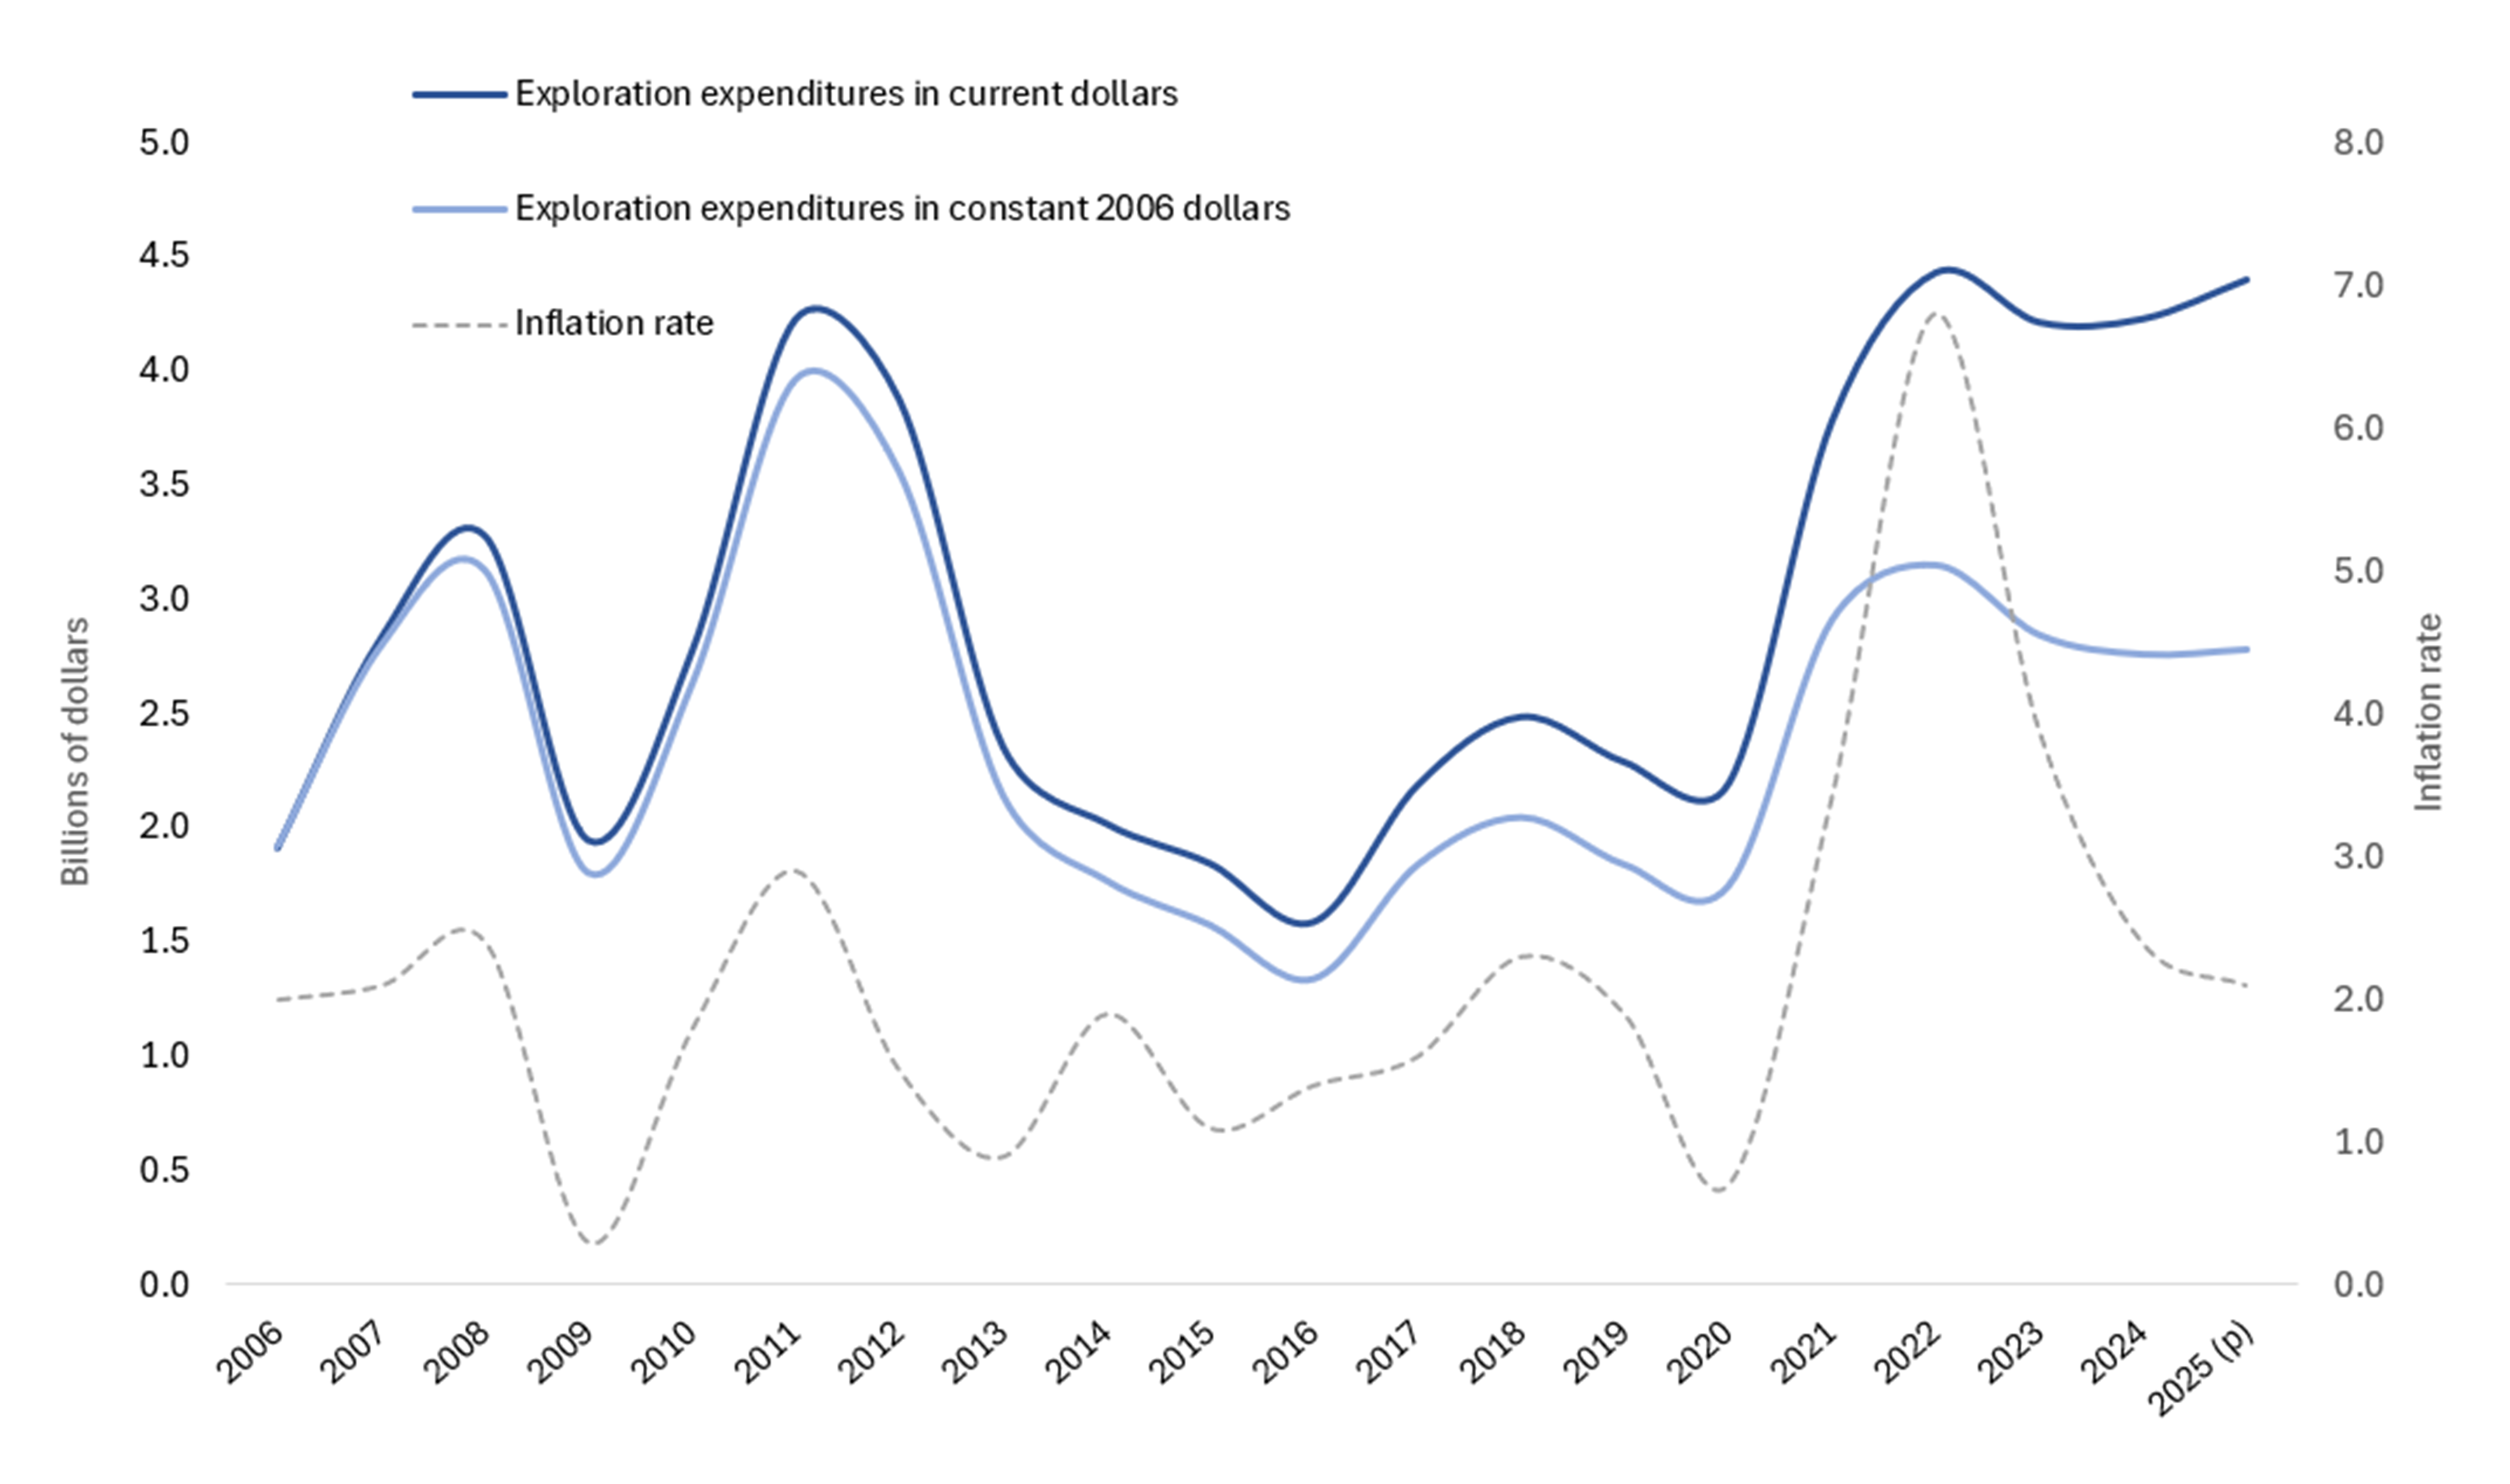
Sources: Natural Resources Canada, Institut de la statistique du Québec, Statistics Canada
p = preliminary expenditures
Figure 2 — Text version
This line graph shows the trend in exploration expenditures in constant and current dollars in relation to the evolution of the inflation rate. The graph illustrates the impact of inflation on exploration and deposit appraisal expenditures.
Junior and senior companies
In 2024, junior exploration companies spent $2.11 billion, essentially unchanged from 2023 ($2.12 billion). Preliminary data for 2025 indicate junior spending increased to $2.27 billion (+8%), and spending intentions for 2026 point to a substantial rise to $2.91 billion. This would represent a new nominal record for junior exploration spending.
Canada is well known for its large contingent of junior companies, which usually have no operating revenue and rely on equity financing. They tend to be small and flexible and to specialize in higher-risk, early-stage exploration activities. Although some junior companies might develop a project on their own or with a partner, senior companies (producers) are traditionally more likely to bring a mine into production.
Junior companies continue to play a vital role in Canada’s exploration landscape. In 2024, they accounted for approximately half of total exploration and deposit appraisal expenditures. Because junior companies rely heavily on equity markets for financing, their spending levels are closely tied to investor sentiment, commodity price expectations and broader financial conditions. As a result, their expenditures tend to be more volatile than those of senior mining companies.
Junior spending has historically fluctuated considerably. After surpassing $2 billion in 2008 and 2011, expenditures declined sharply, reaching a 12-year low in 2015. A recovery began in 2016 and strengthened through 2021 and 2022 before moderating in 2023. The stabilization in 2024 and rebound reflected in the 2025–2026 intentions suggest improving financing conditions and renewed investor interest in exploration, supported by in part by record gold prices.
Senior mining companies spent $2.12 billion in 2024, slightly above 2023 levels. Preliminary results for 2025 show senior spending increasing modestly to $2.13 billion, while spending intentions for 2026 indicate a stronger expansion to $2.43 billion.
Unlike juniors, senior companies generally benefit from operating revenues that can support exploration activity through commodity price cycles, contributing to more stable spending patterns over time.
The distribution of spending between junior and senior companies can shift from year to year depending on overall budget allocations, access to capital, project sales or joint ventures, and companies transitioning from exploration to production. Large individual projects or corporate transactions can also significantly influence annual totals.
Provinces and territories
In 2024, Ontario recorded the highest exploration and deposit appraisal expenditures at $1.09 billion, followed by Quebec ($890 million) and British Columbia ($747 million). Together, these three provinces accounted for approximately 64% of total exploration and deposit appraisal spending in Canada, reflecting the concentration of exploration activity in established mining jurisdictions.
Preliminary results for 2025 show continued strong regional activity, with Ontario remaining the leading jurisdiction at $1.08 billion, followed by Quebec ($955 million) and Saskatchewan ($711 million). Several jurisdictions recorded notable increases in spending in 2025, including Saskatchewan, Yukon, Newfoundland and Labrador, and New Brunswick, while expenditures declined in British Columbia, Manitoba, Nunavut, and the Northwest Territories.
Spending intentions for 2026 suggest a broad expansion in exploration activity across the country. The largest planned expenditures are reported in Quebec ($1.16 billion), British Columbia ($1.03 billion), Ontario ($999 million), and Saskatchewan ($823 million). Significant increases are also planned in northern regions, particularly Yukon ($323 million) and Nunavut ($268 million), reflecting continued exploration interest in Canada’s northern mineral potential.
Mineral commoditiesFootnote 2
Precious metals (mainly gold) remained the leading commodity group in 2025, accounting for 50% of total exploration and deposit appraisal spending, up from 46% in 2024. This increase reflects continued strength in gold exploration activity supported by historically elevated gold prices. Spending on precious metals rose 12% to $2.18 billion in 2025, and spending intentions for 2026 indicate a further 24% increase to $2.69 billion, maintaining the group’s dominant share of exploration spending.
Despite the growing share of spending directed toward critical minerals in recent years, precious metals remain the most sought-after commodity group across most Canadian jurisdictions. Exploration activity continues to reflect gold’s role as both a store of value during periods of economic uncertainty and a core exploration focus for junior companies.
Figure 3. Expenditures, by commodity group, 2025 (p)
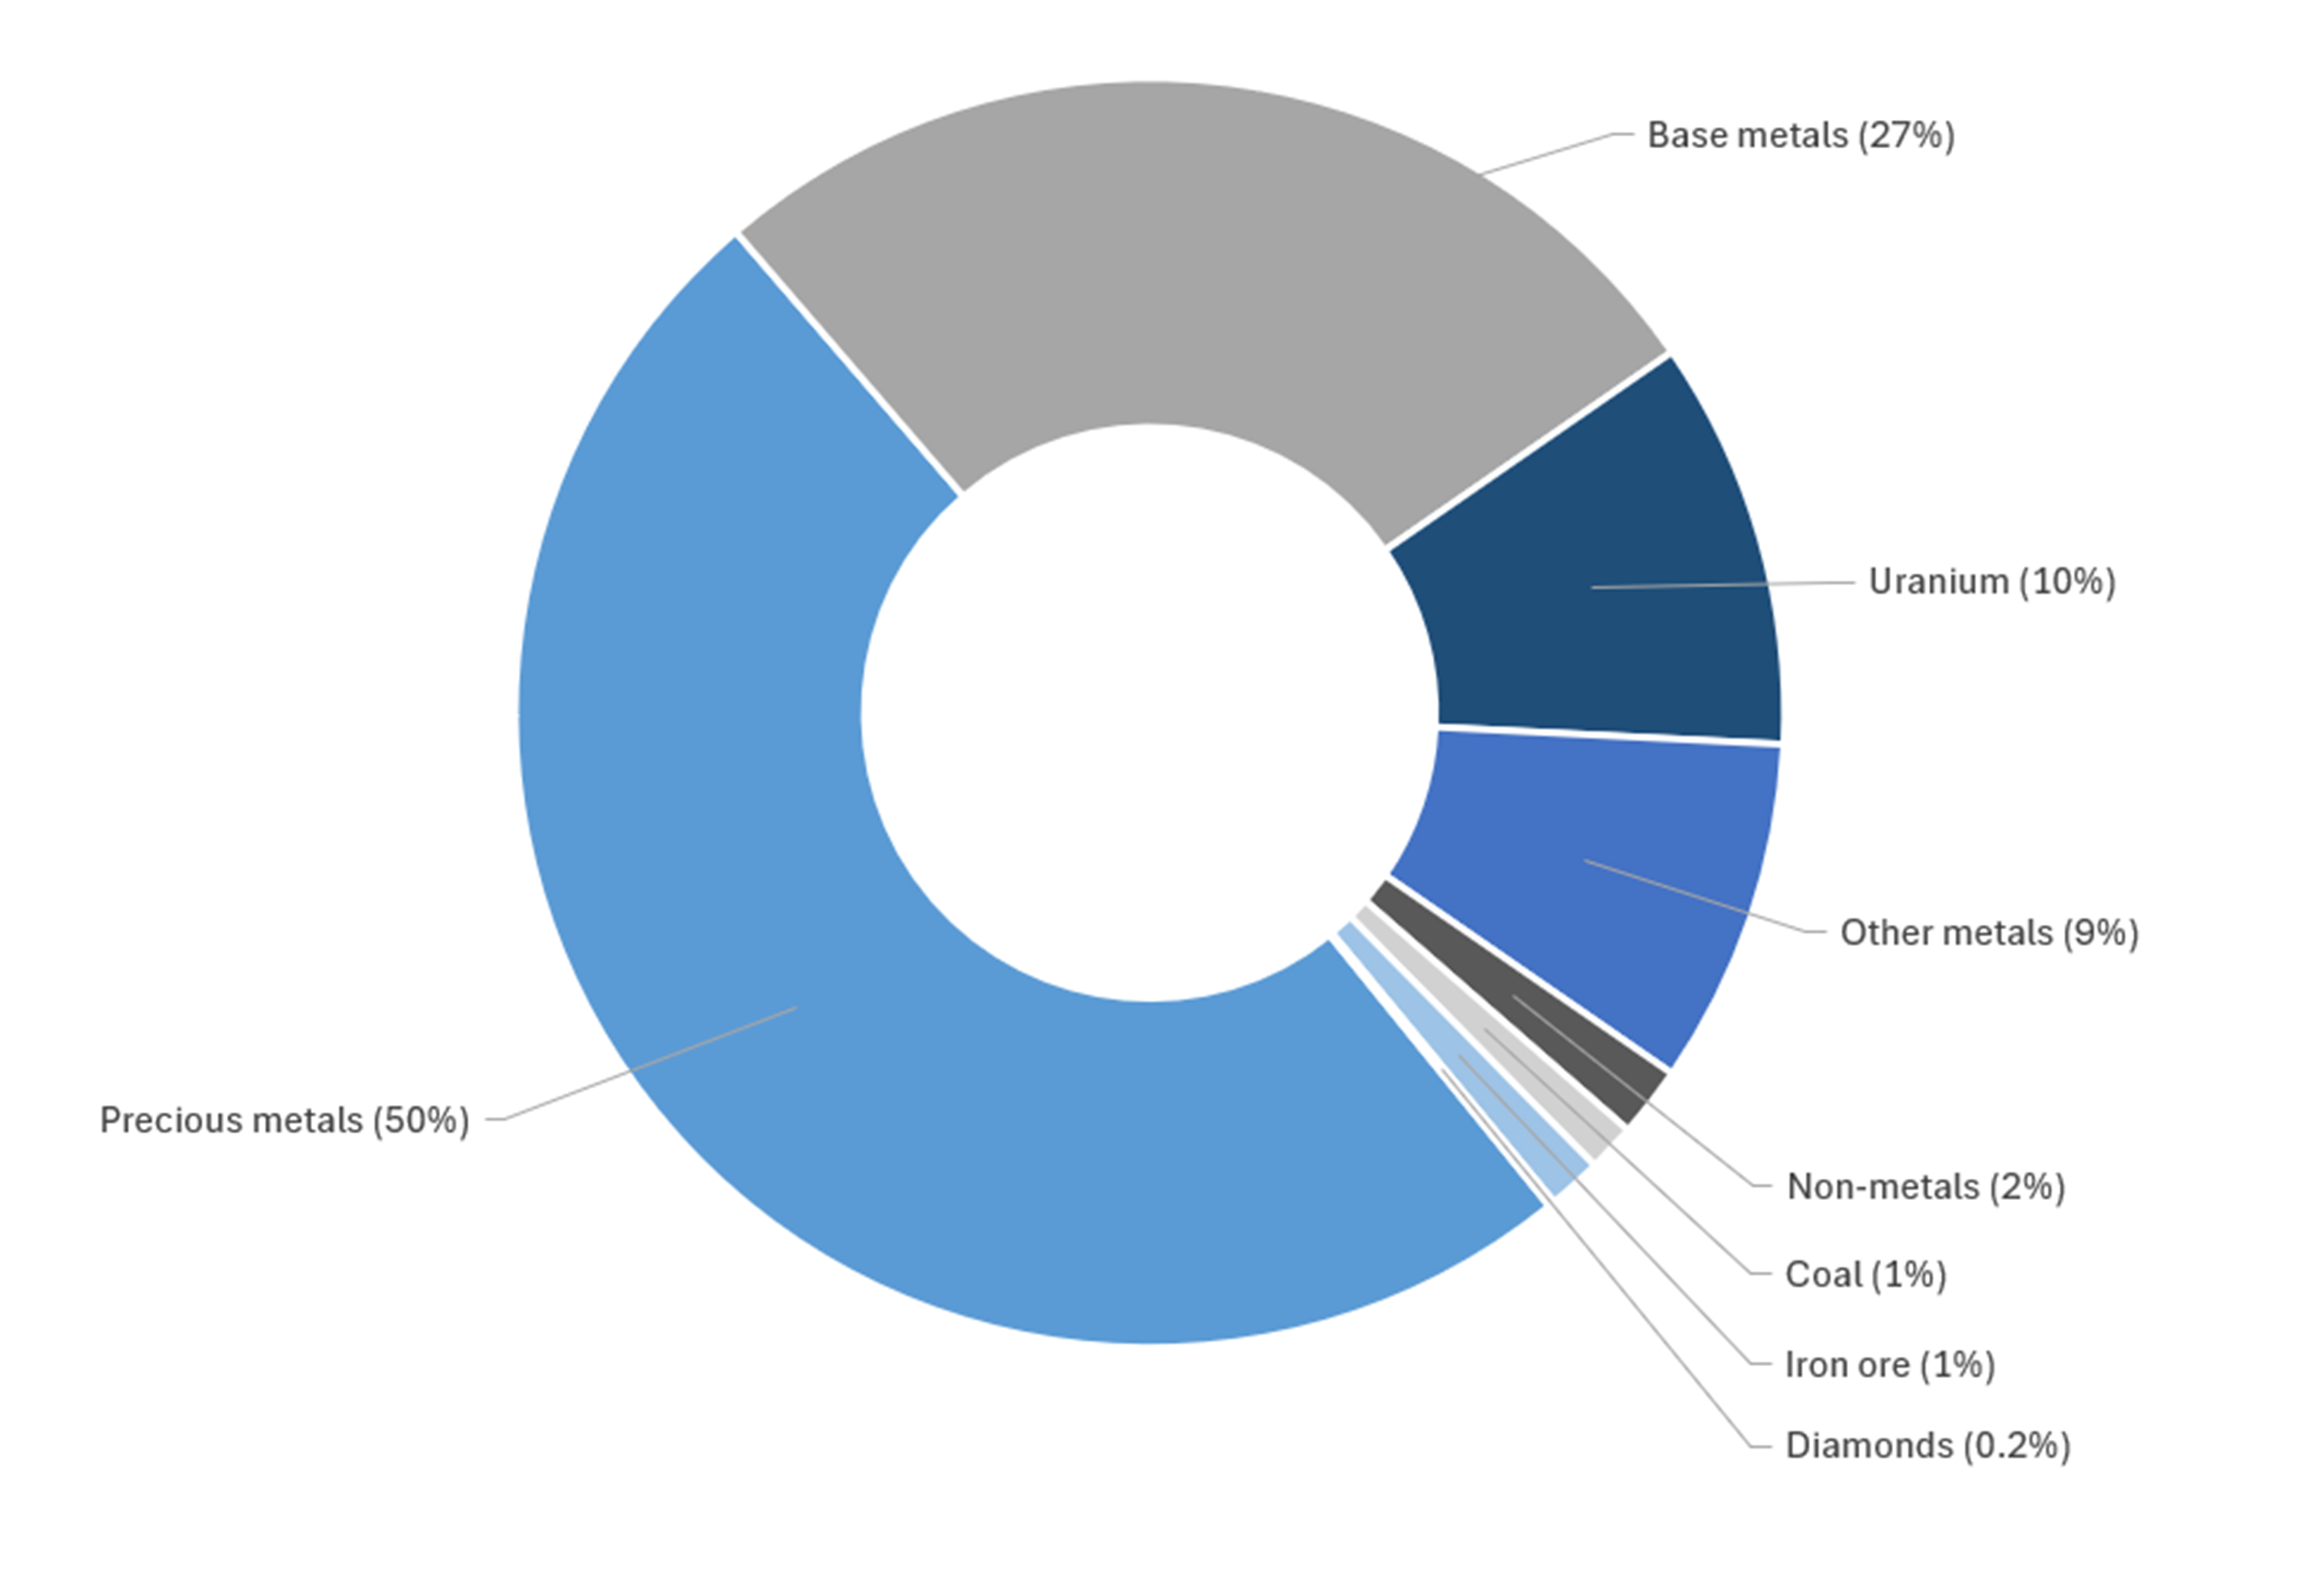
Sources: Natural Resources Canada, Institut de la statistique du Québec
p = preliminary expenditures
Figure 3 — Text version
This pie chart shows exploration and deposit appraisal expenditures by commodity group in 2025 (preliminary). Precious metals account for 50% of total spending, followed by base metals (27%), uranium (10%), other metals (9%), non-metals (2%), coal (1%), iron ore (1%), and diamonds (<1%).
Base metals—including copper, nickel, zinc and lead—remained the second-largest exploration category, representing 27% of total spending in 2025. Exploration expenditures targeting base metals increased 5% to $1.17 billion in 2025 following a 6% rise in 2024. Spending intentions for 2026 indicate relatively stable expenditures at $1.16 billion, although the commodity group’s share of total exploration spending is expected to decline slightly to 22% as overall exploration activity expands more rapidly in other commodities.
Exploration spending targeting base metals has broadly followed metal price trends over the past decade, increasing during the strong commodity cycle from 2017 to 2022 before moderating in 2023. Strong demand for electrification infrastructure, renewable energy systems and electric vehicles continues to support long-term exploration interest in these metals, particularly copper.
Uranium exploration has experienced a strong resurgence in recent years. Spending increased 95% in 2022, followed by further increases of 33% in 2023, 21% in 2024, and 20% in 2025, reaching $458 million. Spending intentions for 2026 indicate a significant 61% increase to $737 million, raising uranium’s share of total exploration spending to 14%. Saskatchewan remains the primary destination for uranium exploration spending in Canada because of its world-class deposits and established mining infrastructure.
The renewed interest in uranium reflects growing global demand for nuclear energy as a reliable low-carbon power source and increasing concerns over energy security. Several countries have announced plans to expand nuclear capacity, supporting renewed exploration interest in uranium resources.
Spending on other metals, which includes lithium, cobalt and rare earth elements, increased sharply earlier in the decade as demand for battery materials expanded. Exploration spending in this category surged 135% in 2023, reaching $616 million, before moderating to $552 million in 2024 and $389 million in 2025 as lithium prices corrected following rapid increases during 2021–2022. Spending intentions for 2026 indicate a modest recovery to $447 million, representing 8% of total exploration spending.
Figure 4. Expenditures, by mineral commodity, 2024 to 2026
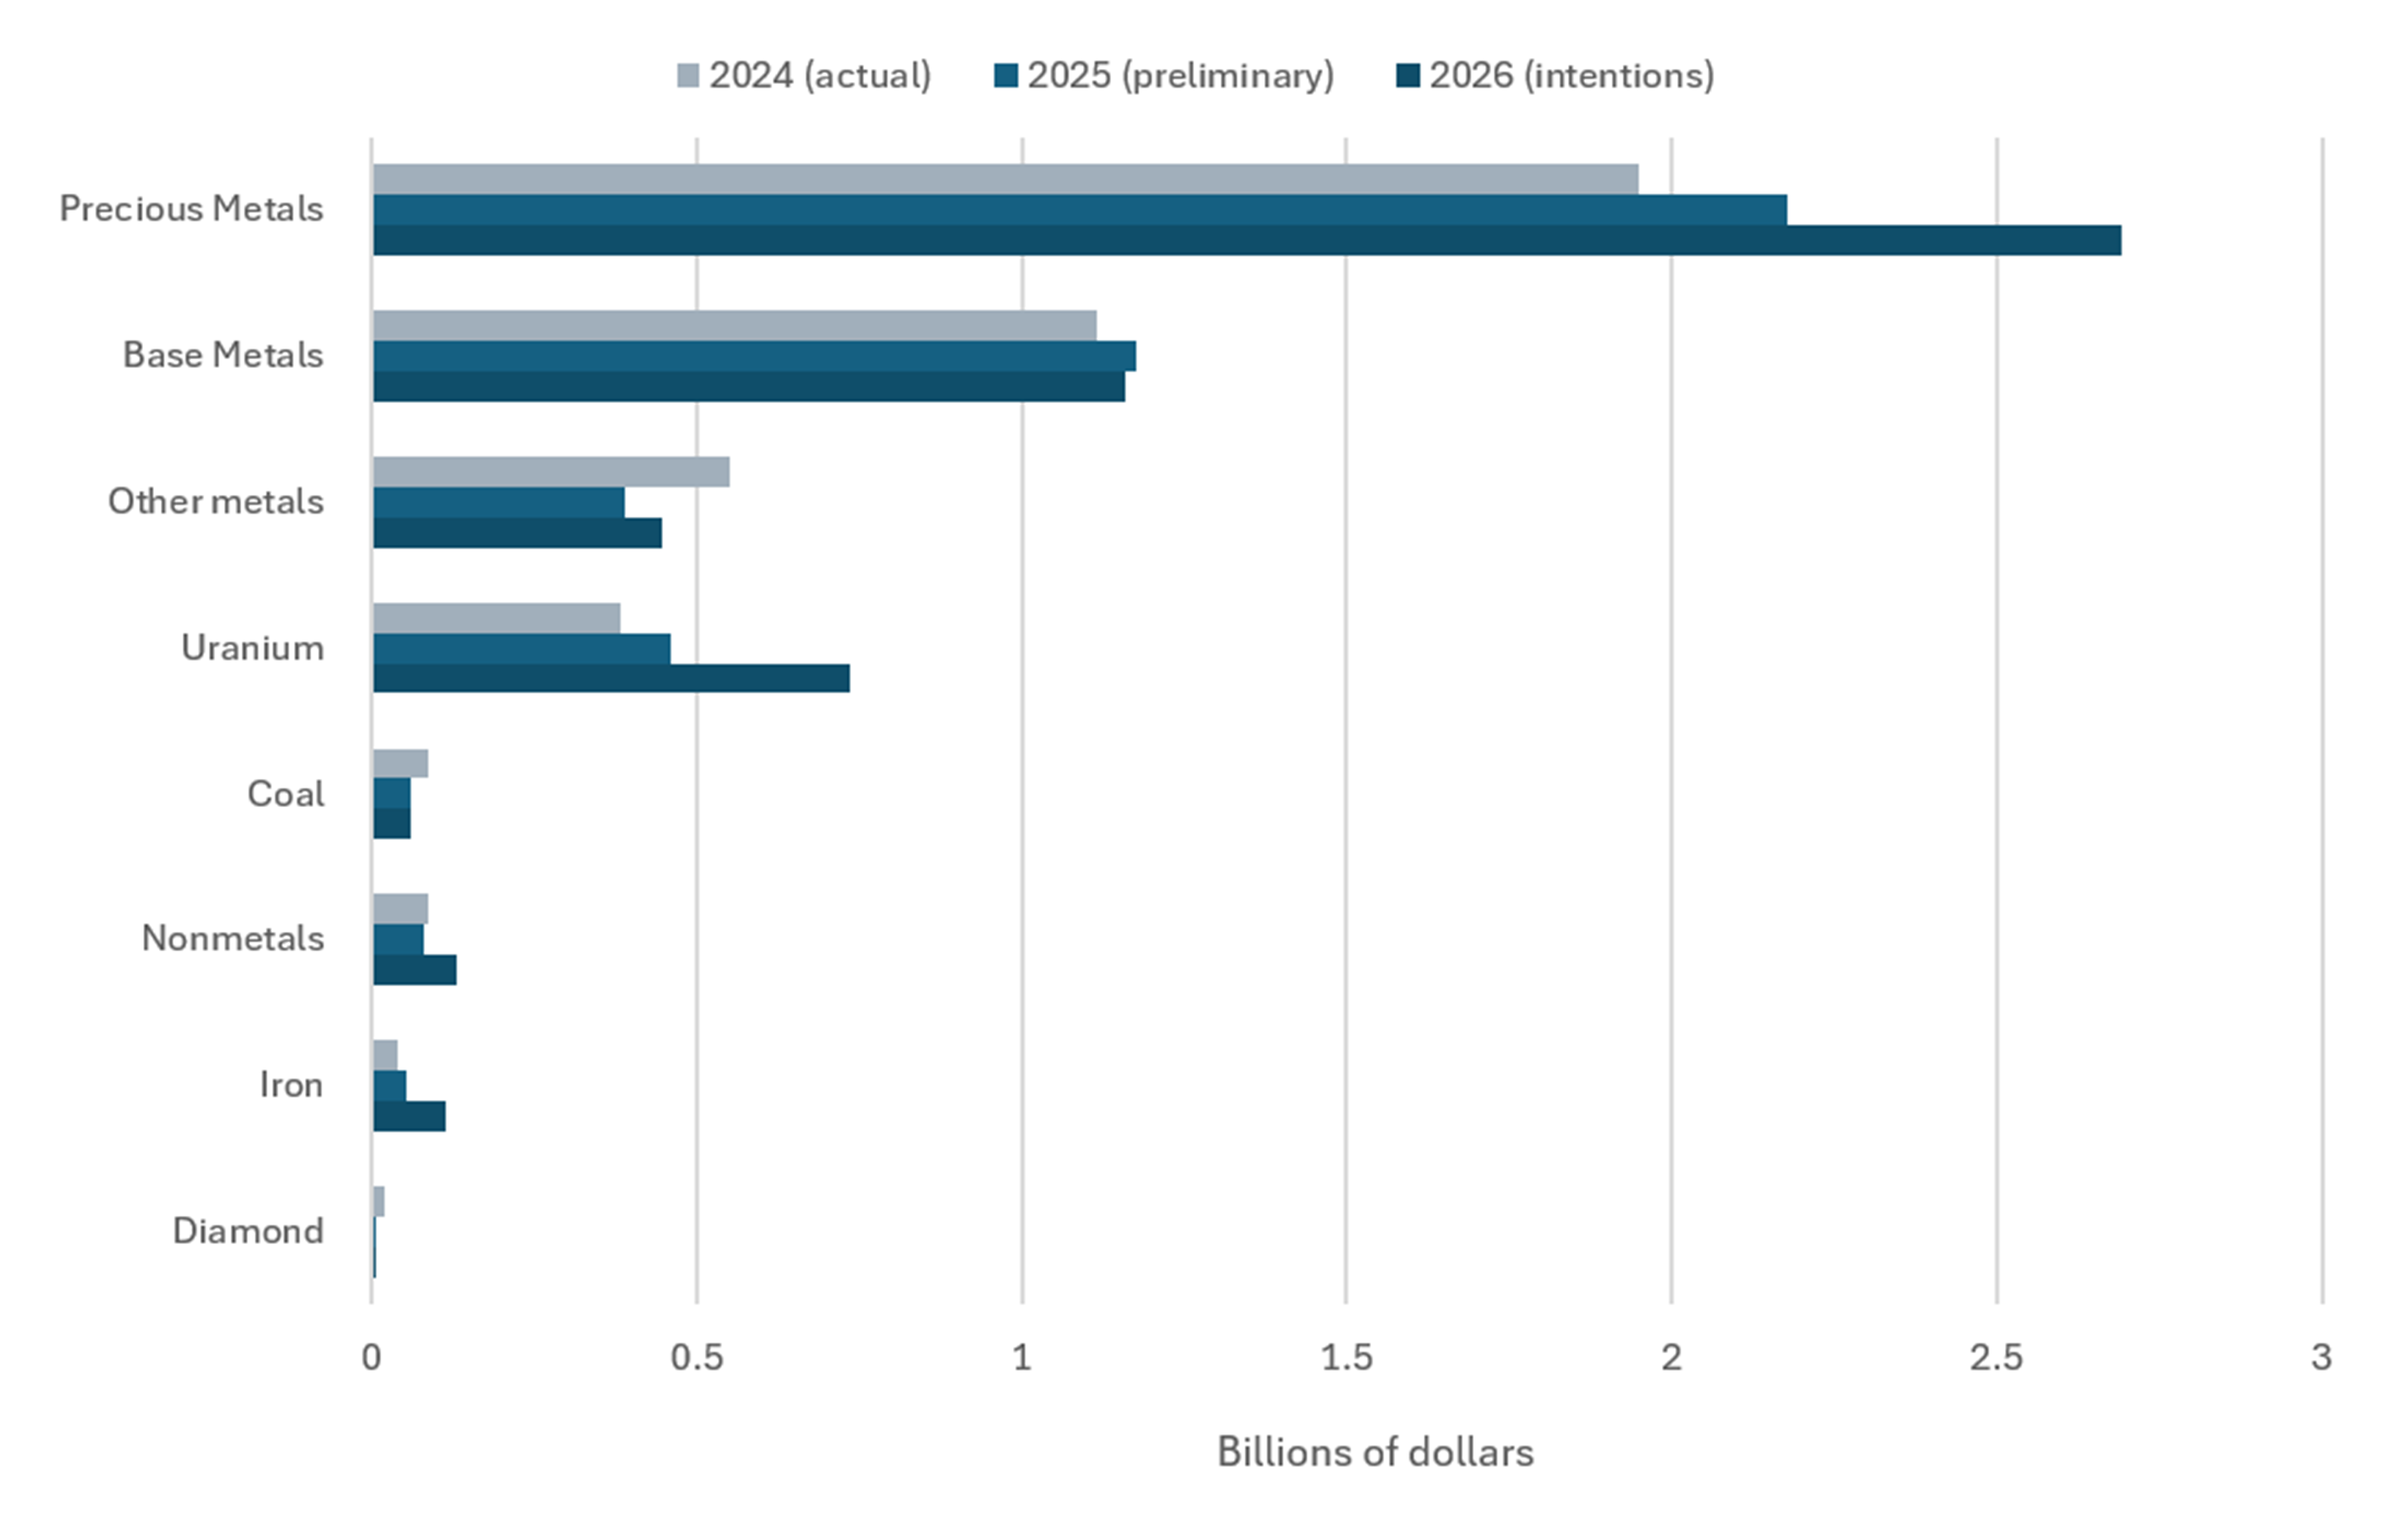
Sources: Natural Resources Canada, Institut de la statistique du Québec
Figure 4 — Text version
This bar chart shows expenditures for exploration and deposit appraisals by mineral commodity from 2024 to 2026. Precious metals consistently account for the largest share of spending, followed by base metals and other metals. Uranium expenditures show a strong upward trend over the period.
Quebec hosted 132 of Canada’s 228 active exploration projects in 2025 targeting lithium as a primary commodity, sometimes alongside other commodities, making it the leading jurisdiction for lithium exploration in Canada. Lithium exploration also occurs in Ontario, Alberta, Saskatchewan, Manitoba, the Northwest Territories and Newfoundland and Labrador. Quebec and Ontario also dominate exploration for cobalt, which is typically produced as a co-product of base metal mining.
Although lithium prices declined sharply after reaching historic highs in 2022 because of oversupply in global battery markets, exploration activity remains elevated compared with pre-2020 levels, reflecting continued long-term demand expectations associated with electric vehicles and energy storage technologies.
Expenditures for non-metals, primarily potash, remained relatively stable at $79 million in 2025, representing about 2% of total exploration spending. Spending intentions for 2026 indicate a 64% increase to $130 million, reflecting continued development activity in Saskatchewan’s potash sector. Canada remains the world’s largest producer of potash, and exploration activity is supported by long-term demand for fertilizers and recent investments in new production capacity, including the development of the Jansen potash project in Saskatchewan.
Exploration spending targeting iron ore has gradually recovered from the lows observed earlier in the decade. Expenditures increased to nearly $54 million in 2025, with spending intentions indicating a further rise to $114 million in 2026. Exploration activity remains concentrated in Quebec, Nunavut and Newfoundland and Labrador, particularly in the Labrador Trough—a major iron ore belt spanning northern Quebec and western Newfoundland and Labrador that hosts some of Canada’s largest iron ore deposits and established mining infrastructure. Canada’s deposits also tend to be high grade and capable of producing high-purity iron ore, which is increasingly sought after for low-carbon steel production using processes such as direct reduced iron.
Expenditures for coal exploration, which includes both metallurgical and thermal coal, declined to $60 million in 2025 and are expected to remain relatively stable in 2026 at approximately $58 million, representing about 1% of total exploration spending. Coal exploration activity in Canada is largely focused on metallurgical coal resources used in steel production.
Exploration spending targeting diamonds continued its long-term decline, falling to $6.8 million in 2025, compared with $35 million in 2023. Spending intentions for 2026 remain modest at $7.3 million. Exploration activity has declined as several Canadian diamond mines approach the end of their operating lives and global diamond markets face structural challenges.
Critical mineralsFootnote 3
In 2025, $2.1 billion was spent on exploration for critical minerals, a slight decrease (2%) from the previous year. Record gold prices drew exploration investment toward precious metals, while prices for several key critical minerals, including nickel and lithium, declined. Although spending intentions for 2026 are not available for critical minerals as a distinct category, overall expenditures are expected to remain broadly stable. Strong growth in uranium exploration is anticipated to be partly offset by declines in other commodity groups that include critical minerals, particularly other metals and base metals.
Figure 5. Expenditures, by major critical minerals, 2023 to 2025
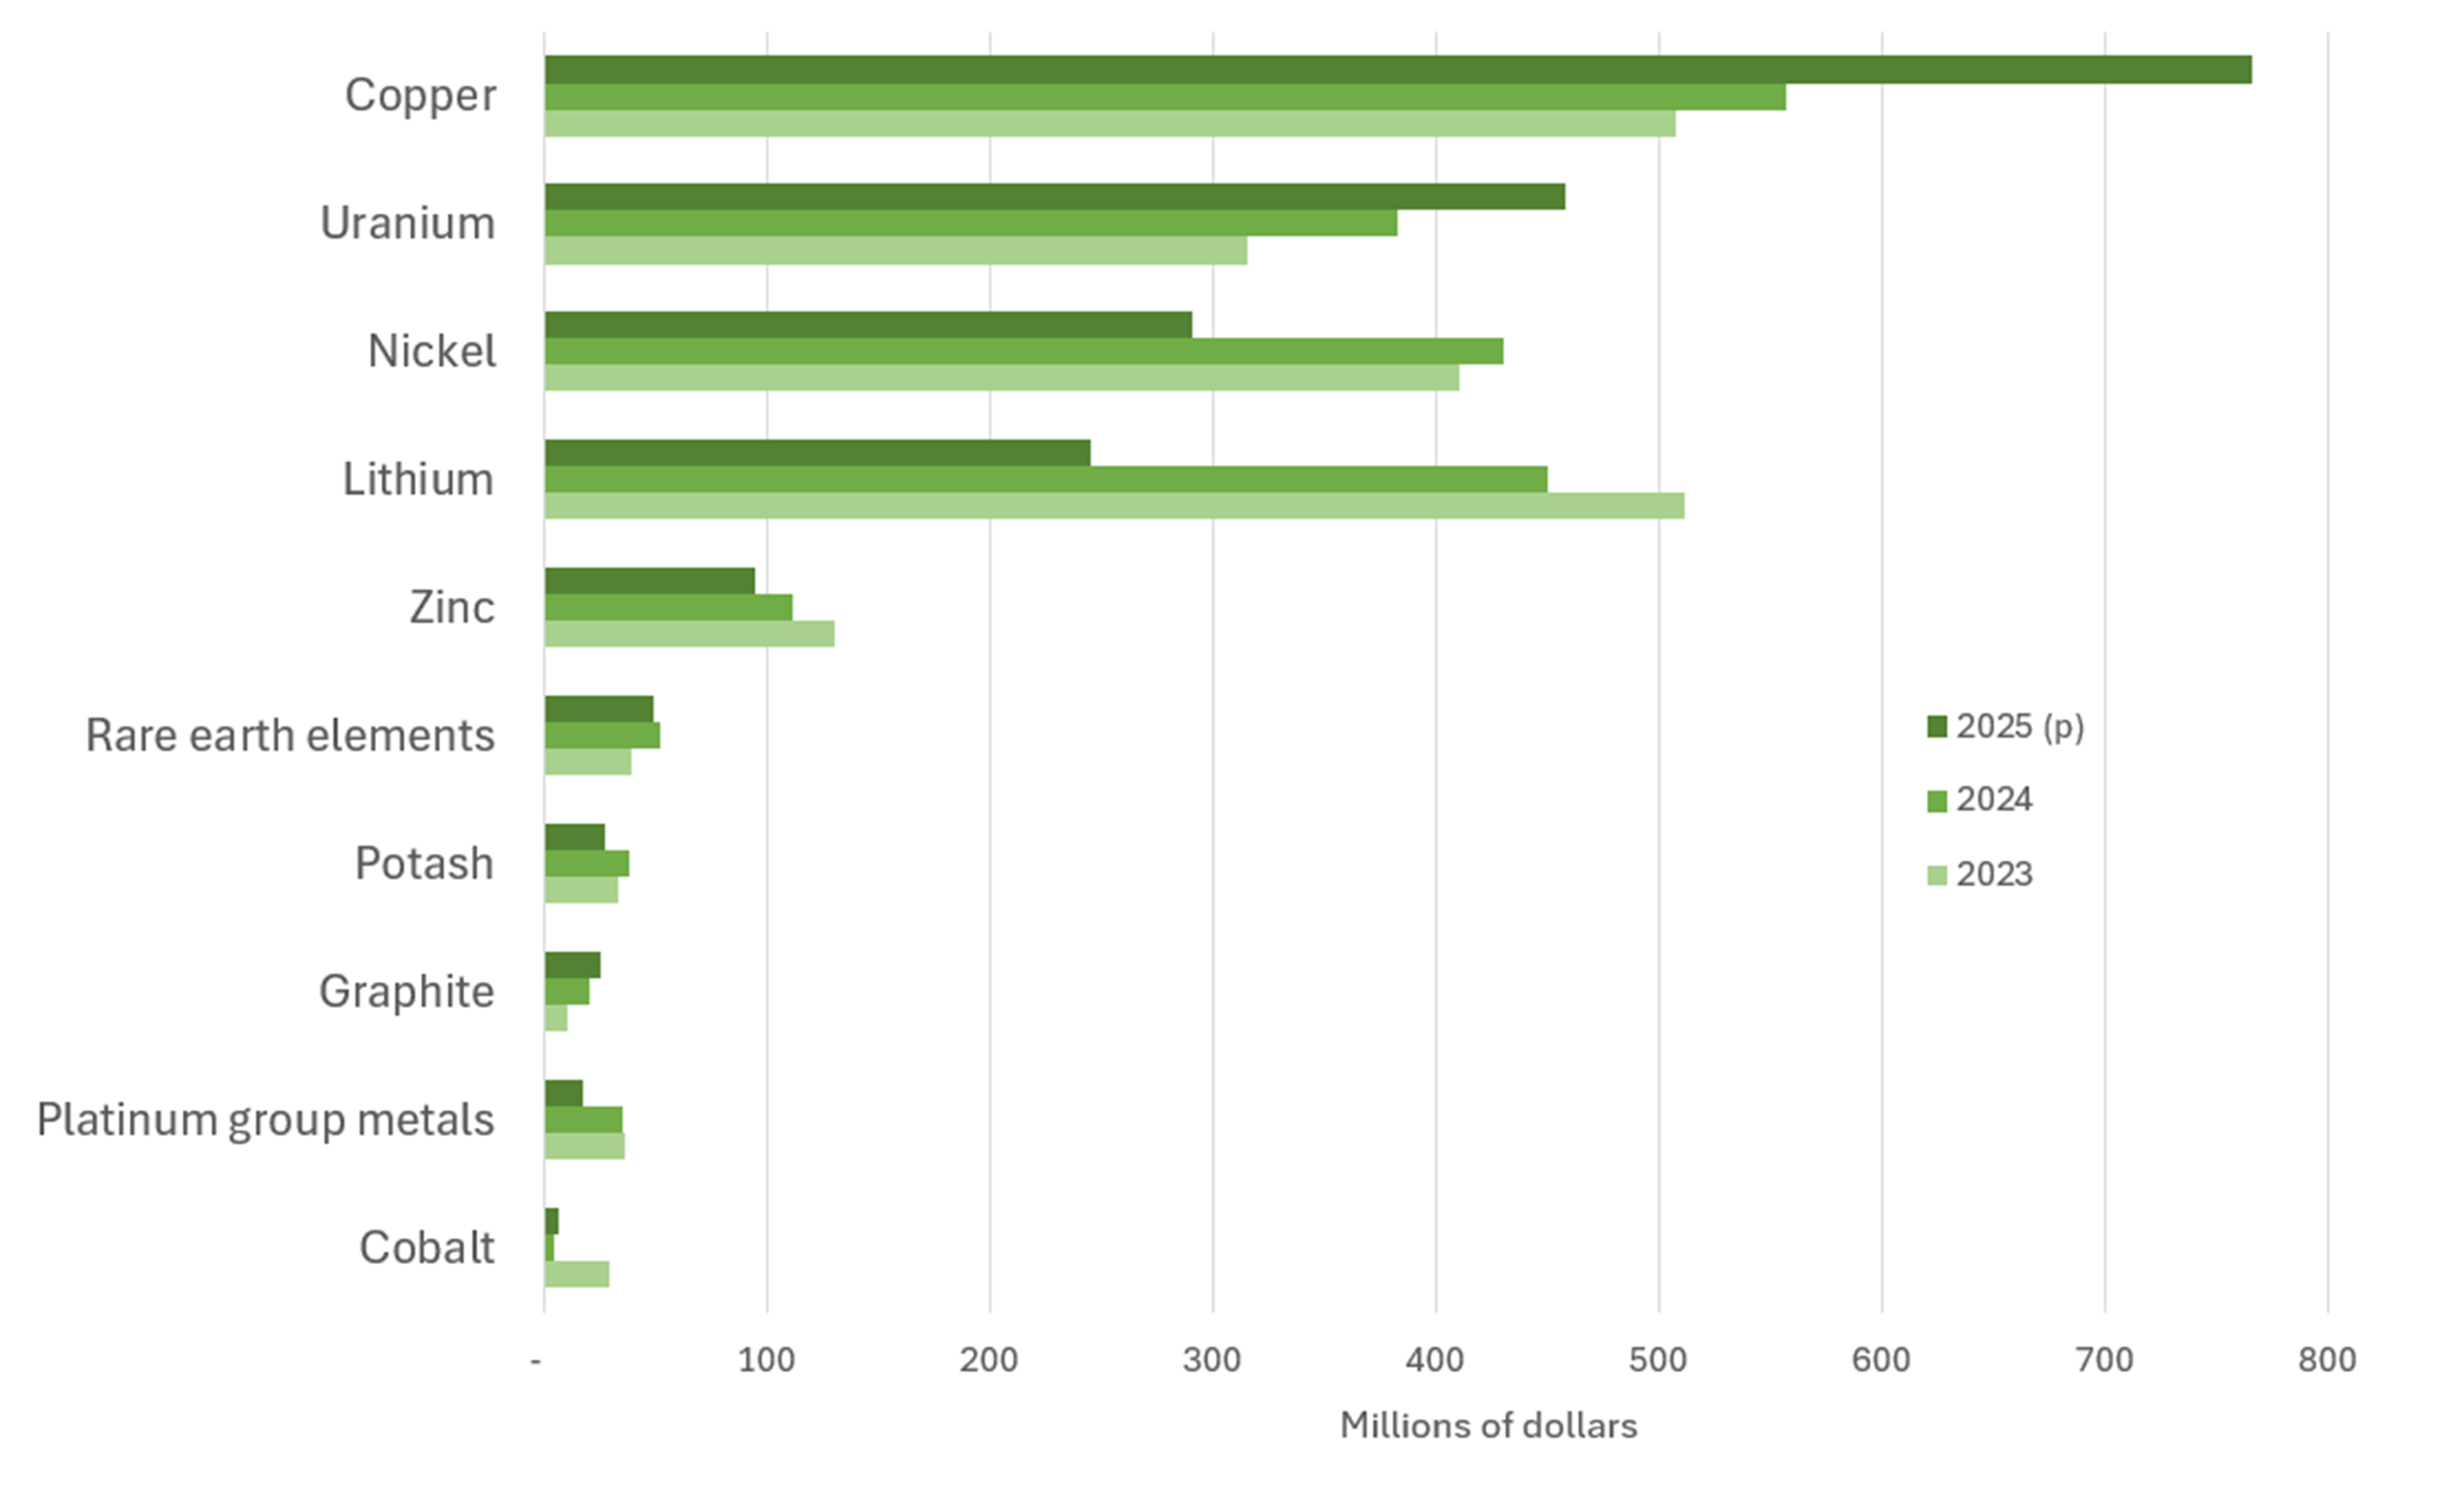
Sources: Natural Resources Canada, Institut de la statistique du Québec
p = preliminary expenditures,
Figure 5 — Text version
This bar chart shows expenditures for exploration and deposit appraisals for major critical minerals from 2023 to 2025. For each year, there are bars for copper, lithium, nickel, uranium, zinc, platinum group metals, potash, rare earth elements, cobalt and graphite.
Exploration spending for minerals such as copper, nickel, lithium, uranium, rare earth elements, graphite and potash has increased significantly since 2020, reflecting both strong global demand for materials used in clean energy technologies and policy efforts to strengthen secure supply chains among Canada and its allies. In 2025, exploration expenditures targeting critical minerals continued to represent a substantial share of Canada’s total exploration spending at 47%, up from 25% in 2020, highlighting the increasing strategic importance of these resources to the country’s mining sector and long-term economic development.
In March 2021, the Government of Canada released a list of 31 critical minerals considered essential to Canada’s economic security and the global transition to cleaner energy systems. The list was subsequently expanded to 34 critical minerals in 2024 following a review to reflect evolving technologies, market dynamics and supply chain priorities. Building on this work, the federal government launched the Canadian Critical Minerals Strategy in December 2022, which sets out a comprehensive approach to strengthening Canada’s critical mineral value chains—from exploration and mining to processing, manufacturing and recycling.
A key objective of the strategy is to accelerate exploration and support the discovery of new critical mineral deposits in Canada. Several federal initiatives directly support exploration activity. The Critical Mineral Exploration Tax Credit (CMETC) provides a 30% tax credit for investors in eligible flow-through share financing targeting critical mineral exploration expenses. The CMETC complements the long-standing Mineral Exploration Tax Credit, which provides a 15% tax credit for flow-through share investments in exploration for other minerals. Together, these incentives are designed to encourage early-stage exploration investment and improve access to capital for junior exploration companies.
Additional federal support for exploration includes investments in geoscience programs such as the Targeted Geoscience Initiative and Geo-mapping for Energy and Minerals, which improve geological knowledge in prospective regions, particularly in northern Canada. Programs supporting infrastructure development, Indigenous partnerships and regulatory improvements are also intended to facilitate responsible exploration and development of critical mineral resources. These initiatives, and those of provinces and territories, have contributed to growing exploration activity targeting critical minerals across Canada.
Find out more about critical minerals in Canada, including available programs and funding for projects, as well as an interactive map of advanced projects, mines and processing facilities across the country.
Work phases
In 2025, total expenditures for exploration and deposit appraisal increased compared with 2024, driven by higher spending on deposit appraisal activities despite a slight decline in exploration expenditures. Off-mine sites, which are not located on the premises of producing mines, continued to account for the majority of exploration activity in Canada:
Work phases correspond to different stages of mineral exploration and project development:
- Exploration includes grassroots (early) exploration until it is confirmed that the project is economically feasible.
- Deposit appraisal turns into detailed work included in feasibility studies, which inform a production decision.
- Mine complex development (not covered in this report) includes the construction of mines, plants and associated infrastructure.
On-mine-site activities offer insight on efforts by producing companies to extend the life of existing operations.
- Off-mine site expenditures
- exploration - decreased by 5%
- deposit appraisal – increased by 12%
- On-mine site expenditures
- exploration - increased by 17%
- deposit appraisal - increased by 52%
Off-mine site exploration spending declined by $119 million in 2025 to $2.24 billion. Notable decreases occurred in British Columbia (-$93 million), Ontario (-$82 million) and Manitoba (-$29 million). In contrast, several jurisdictions recorded increases, including Yukon (+$65 million) and Quebec (+$57 million).
On-mine site exploration spending increased by $76 million to $529 million in 2025. The largest increases were observed in Ontario (+$63 million) and British Columbia (+$45 million), reflecting exploration activities aimed at extending the life of existing mining operations.
Deposit appraisal expenditures rose significantly in 2025, increasing by $215 million compared with 2024. The largest increases were observed in Saskatchewan (+$158 million) and Newfoundland and Labrador (+$67 million), reflecting increased investment in evaluating and advancing mineral deposits.
Figure 6. Expenditures, by on-mine and off-mine sites, 2025 to 2026
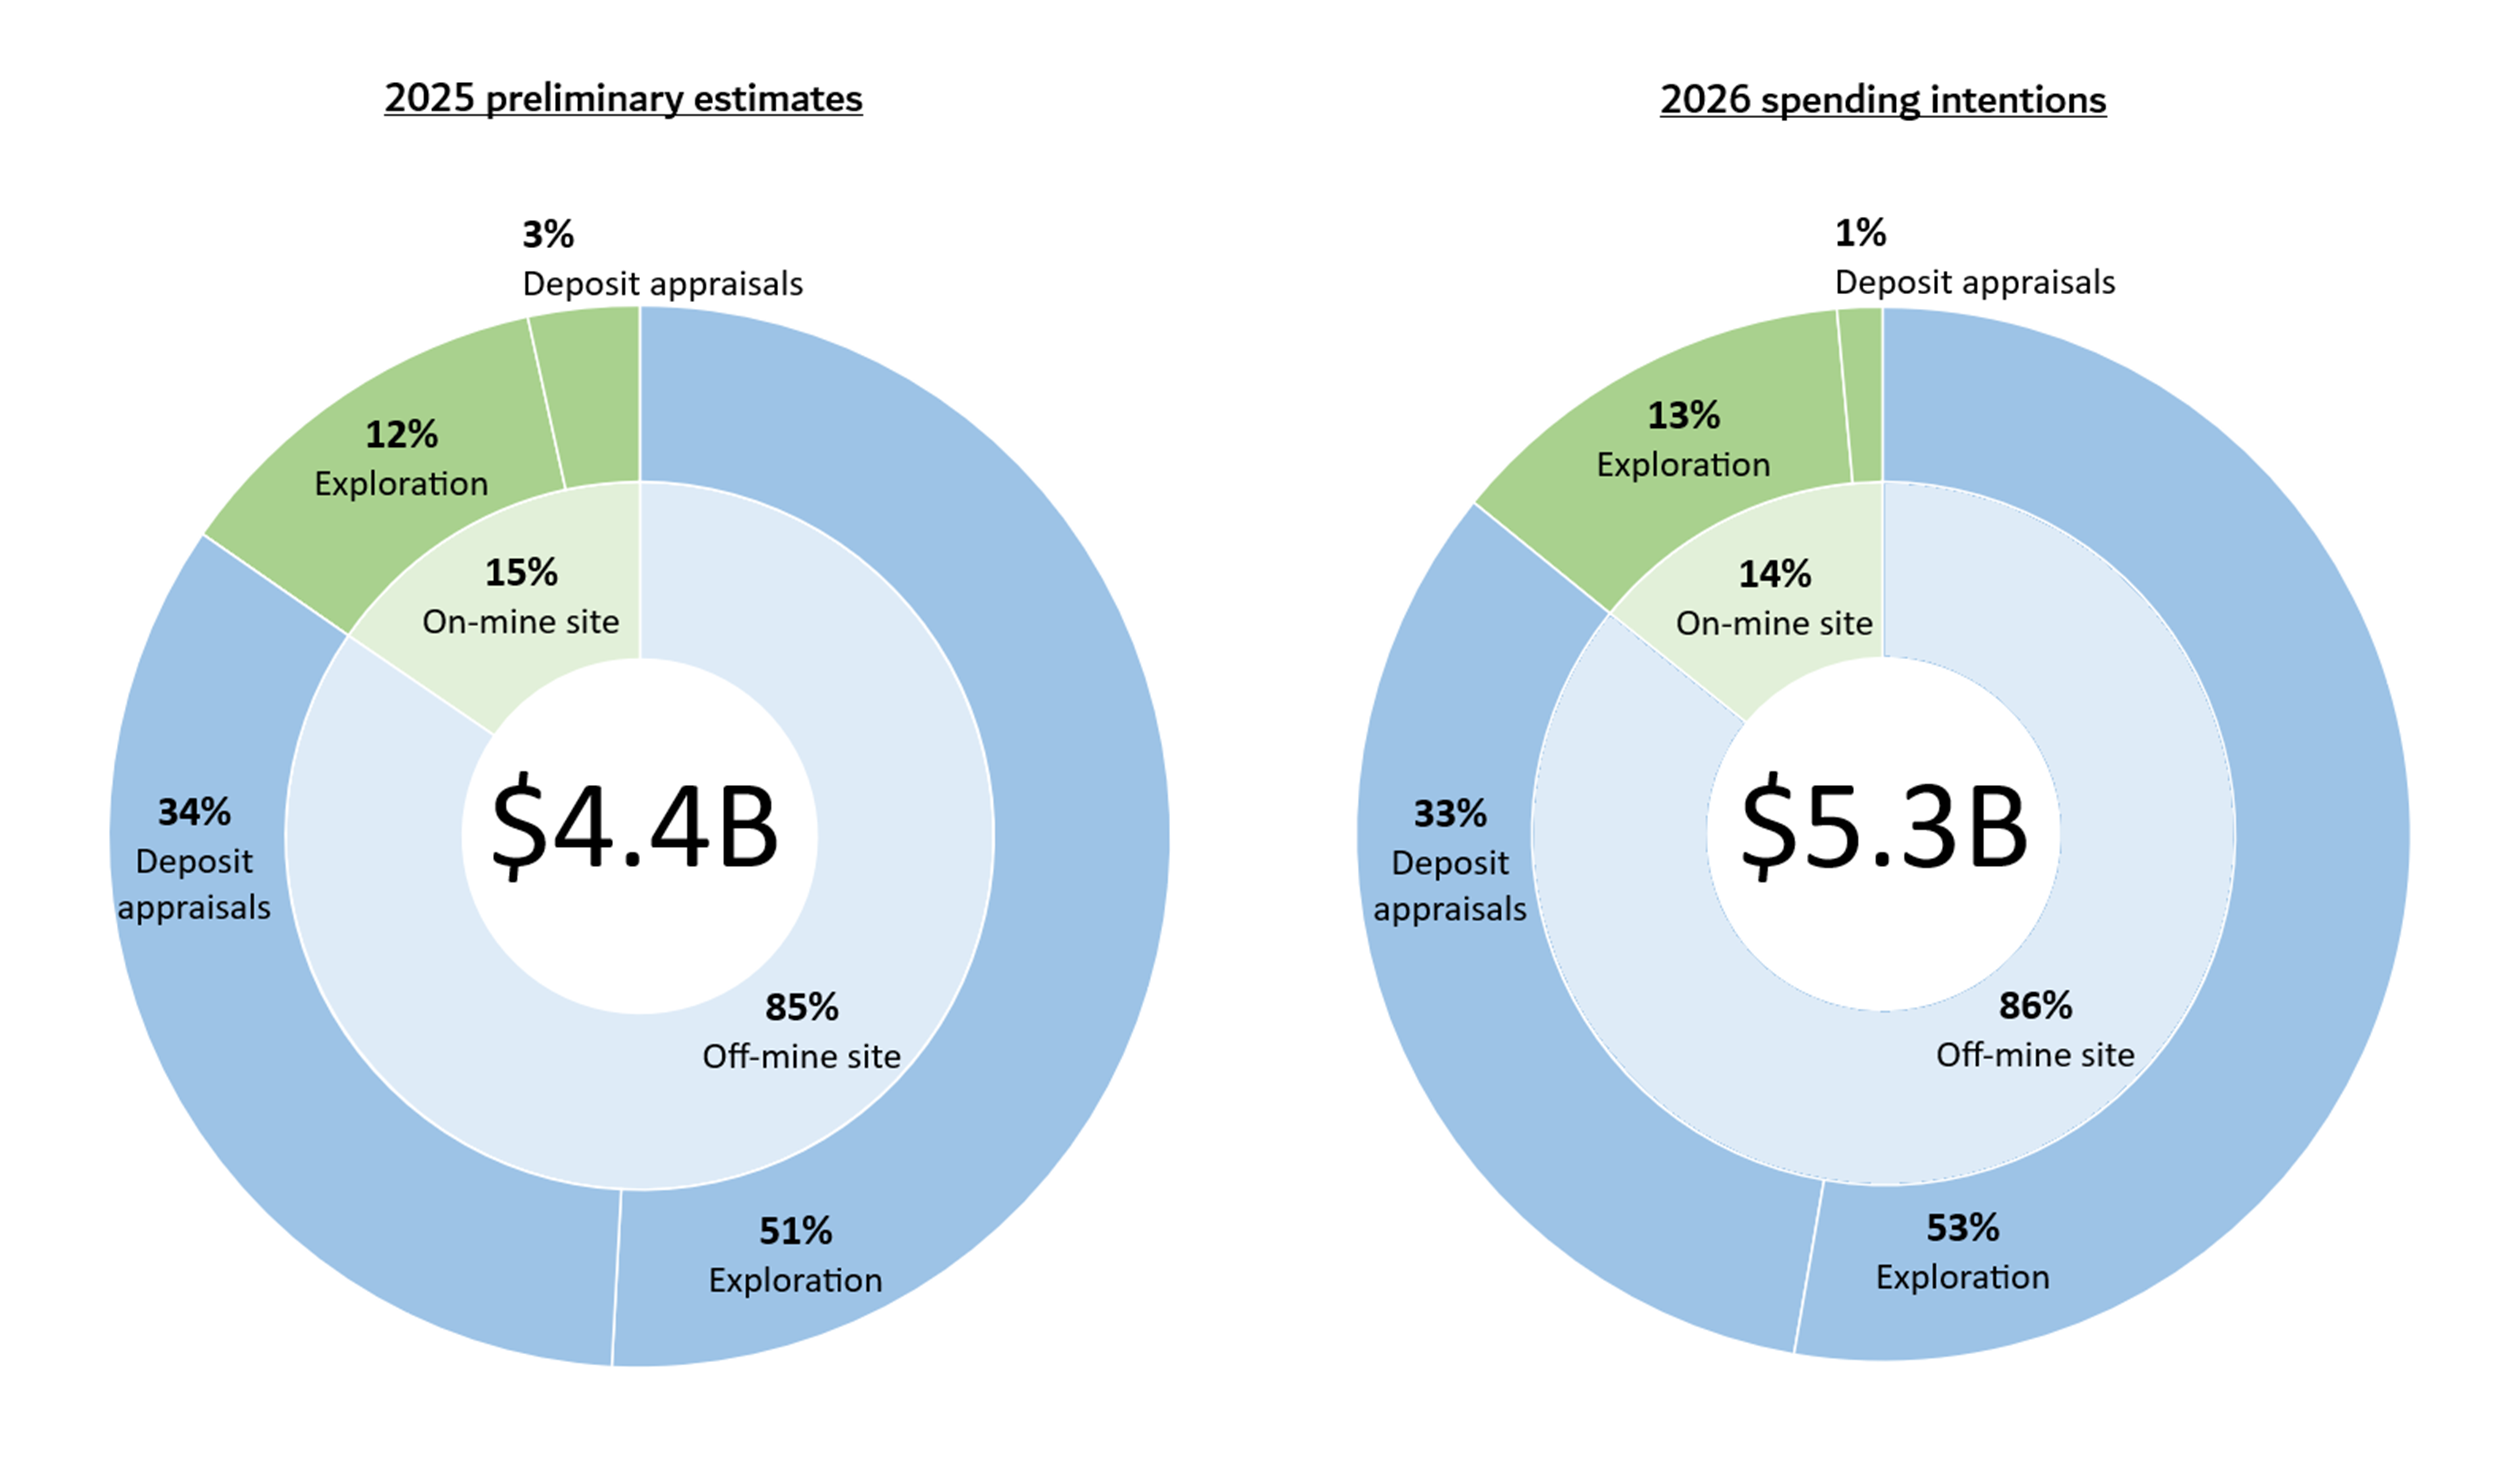
Sources: Natural Resources Canada, Institut de la statistique du Québec
B = billion
Figure 6 — Text version
These two pie charts show expenditures for exploration and deposit appraisals for on-mine and off-mine sites activities for 2025 and 2026. In each year, the majority of exploration spending occurs off mine sites, reflecting the importance of early-stage exploration in identifying new mineral deposits.
Notes
- Totals may be different because of rounding.
- Values are in Canadian dollars.