
Statement outlining results, risks and significant changes in operations, personnel and programs
1. Introduction
This quarterly financial report should be read in conjunction with the Main Estimates and any Supplementary Estimates approved in a given year by the date of this report, as well as Canada’s Budget 2018. It has been prepared by management as required by section 65.1 of the Financial Administration Act and in the form and manner prescribed by Treasury Board. This quarterly financial report has not been subject to an external audit or review.
1.1 Authority, Mandate and Programs
Natural Resources Canada (NRCan) works to improve the quality of life of Canadians by ensuring that our natural resources are developed sustainably, providing a source of jobs, prosperity, and opportunity, while preserving our environment and respecting our communities and Indigenous peoples.
Further details on NRCan’s authority, mandate and programs can be found in Part II of the Main Estimates.
1.2 Basis of Presentation
This quarterly financial report has been prepared by management using an expenditure basis of accounting. The accompanying Statement of Authorities includes NRCan’s spending authorities granted by Parliament and those used by NRCan for the 2018-19 fiscal year, consistent with the Main Estimates, Supplementary Estimates (A) and allocations from Treasury Board central votes for the Operating and Capital budget carry forward and Budget Implementation. This quarterly report has been prepared using a special purpose financial reporting framework designed to meet financial information needs with respect to the use of spending authorities.
The authority of Parliament is required before money can be spent by the Government. Approvals are given in the form of annually approved limits through appropriation acts, or through legislation in the form of statutory spending authority for specific purposes.
NRCan uses the full accrual method of accounting to prepare and present its annual unaudited departmental financial statements that are part of the departmental results reporting process. However, the spending authorities voted by Parliament remain on an expenditure basis.
2. Highlights of Fiscal Quarter and Fiscal Year-to-Date Results
This Departmental Quarterly Financial Report reflects the results as of December 31, 2018, which include Main Estimates, Supplementary Estimates (A) and allocations from the Budget Implementation Vote for which full supply was released, whereas the December 31, 2017 results include Main Estimates, Supplementary Estimates (A) and Supplementary Estimates (B). The details presented in this report focus on and compare the third quarter results of 2018-19 with those of 2017-18.
2.1 Authorities
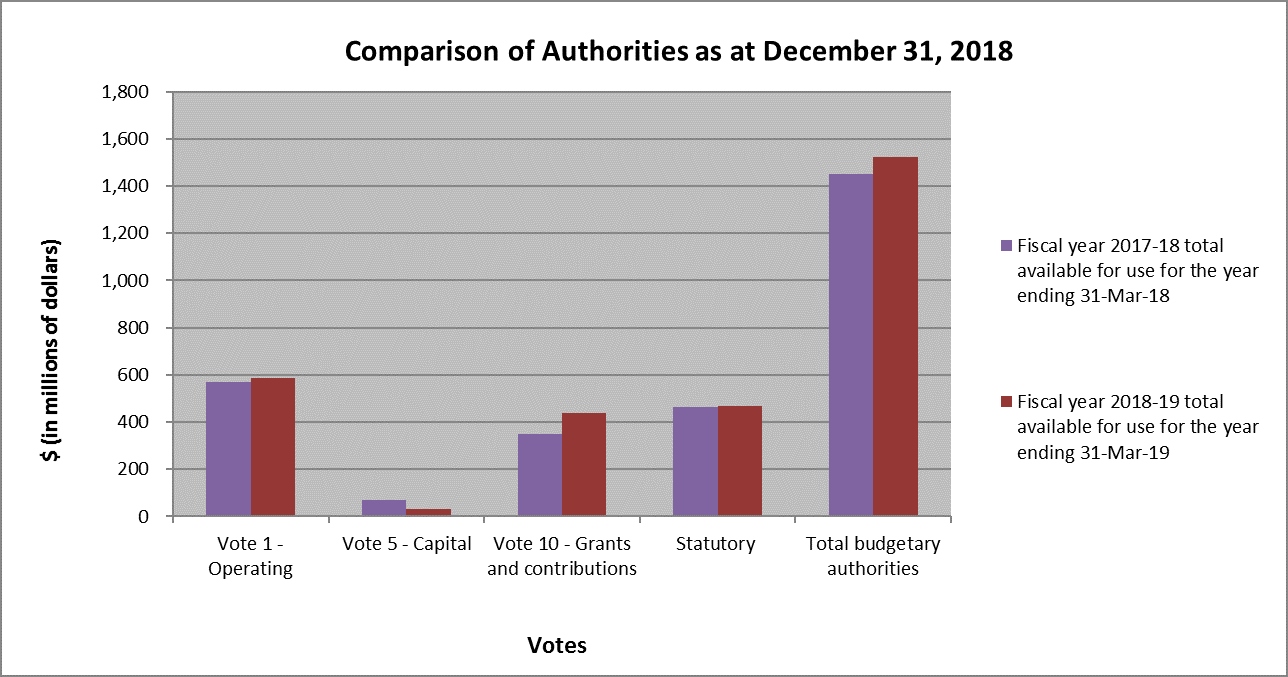
As per Table 1, presented at the end of this document, and on Graph 1 below, as at December 31, 2018, NRCan has authorities available for use of $1,524 million in 2018-19 compared to $1,451.5 million as of December 31, 2017, for a net increase of $72.5 million or 5%.
Graph 1
Text version
| (in millions of dollars) | Fiscal year 2017-2018 total available for use for the year ending 31-Mar-18 |
Fiscal year 2018-2019 total available for use for the year ending 31-Mar-19 |
|---|---|---|
| Vote 1 - Operating | 568 | 585 |
| Vote 5 - Capital | 69 | 32 |
| Vote 10 - Grants and contributions | 351 | 439 |
| Statutory | 464 | 468 |
| Total budgetary authorities | 1,452 | 1,524 |
The increase of $72.5 million in authorities in 2018-19 compared to 2017-18 is explained by the net change within Vote 1 operating expenditures, Vote 5 capital expenditures, Vote 10 grants and contributions, and statutory authorities. The following table provides a detailed explanation of these changes.
| Vote 1 - Operating | |
|---|---|
| New and increased funding for the Green Infrastructure initiative | 20,177 |
| New funding for Impact Assessment and Regulatory Processes | 9,966 |
| New funding for Advancing Clean Technology | 3,798 |
| New funding for Green Construction Through Wood | 2,306 |
| New funding for the Impact Canada initiative | 1,967 |
| New funding for Protecting Jobs in Eastern Canada’s Forestry Sector (Spruce Budworm Early Intervention Strategy) | 1,690 |
| Reduction for retroactive payments related to collective bargaining disbursed in 2017-18 | (10,427) |
| Reduction in funding year-over-year for the Federal Infrastructure Initiative (FII) as the program nears completion | (5,977) |
| Transfers from Operating to Capital, as part of a planned increase in capital spending | (5,907) |
| Reduction in funding year-over-year for the Geo-Mapping for Energy and Minerals Initiative | (2,148) |
| Various minor net increases | 1,879 |
| Sub total Vote 1 - Operating | 17,324 |
| Vote 5 - Capital | |
| Transfers from Operating to Capital, as part of a planned increase in capital spending | 5,907 |
| Proceeds from the sale of real property | 4,900 |
| Reduction in funding year-over-year for the FII as the program nears completion | (45,956) |
| Decrease in Capital Budget Carry Forward | (1,789) |
| Various minor net decreases | (172) |
| Sub total Vote 5 - Capital | (37,110) |
| Vote 10 - Grants & Contributions | |
| New and increased funding for the Green Infrastructure initiative | 58,722 |
| New funding for Advancing Clean Technology | 46,070 |
| New funding for the Impact Canada initiative | 26,283 |
| New funding for Protecting Jobs in Eastern Canada’s Forestry Sector (Spruce Budworm Early Intervention Strategy) | 9,200 |
| New funding for the Implementation of the Indigenous Advisory and Monitoring Committees for Energy Infrastructure Projects | 6,000 |
| Increased funding for Adapting to the Impacts of Climate Change | 5,000 |
| Increased funding for Gunnar mine remediation due to reprofile from 2017-18 | 4,668 |
| Increased funding for World Class Tanker Safety due to reprofile from 2016-17 | 2,100 |
| Sunsetting of the Oil and Gas Clean Technology Program in 2017-18 | (44,478) |
| Reduction in funding year-over-year for the Softwood Lumber Action Plan due to reprofile in 2017-18 | (13,835) |
| Reduction in funding year-over-year for the ecoENERGY for Renewable Power program as the program nears completion | (12,875) |
| Various minor net increases | 831 |
| Sub total Vote 10 - Grants & Contributions | 87,686 |
| Statutory | |
| Newfoundland Offshore Petroleum Resource Revenue Fund, as it was forecasted at the time of Main Estimates that more revenue would be collected in 2018-19 than in 2017-18, due to fluctuations in oil prices and variances in productionTable note * | 5,140 |
| Employee Benefit Plan (EBP) adjustments, due to increased salaries in 2018-19 compared to 2017-18, which was slightly offset by the EBP rate decrease in 2018-19 compared to 2017-18 | 2,100 |
| Payments of the Crown Share Adjustment for Nova Scotia Offshore Petroleum Resources, as it reflects the declining production at the Sable Energy Project and its expected decommissioning by 2018-19 | (1,380) |
| Nova Scotia Offshore Revenue Account, as it was forecasted at the time of Main Estimates that less revenue would be collected in 2018-19 than in 2017-18 due to variances in production and fluctuations in natural gas pricesTable note * | (1,268) |
| Minister of Natural Resources – Salary and motor car allowance | 2 |
| Sub total Statutory | 4,594 |
| Total Variance | 72,494 |
2.2 Budgetary Expenditures by Standard Object
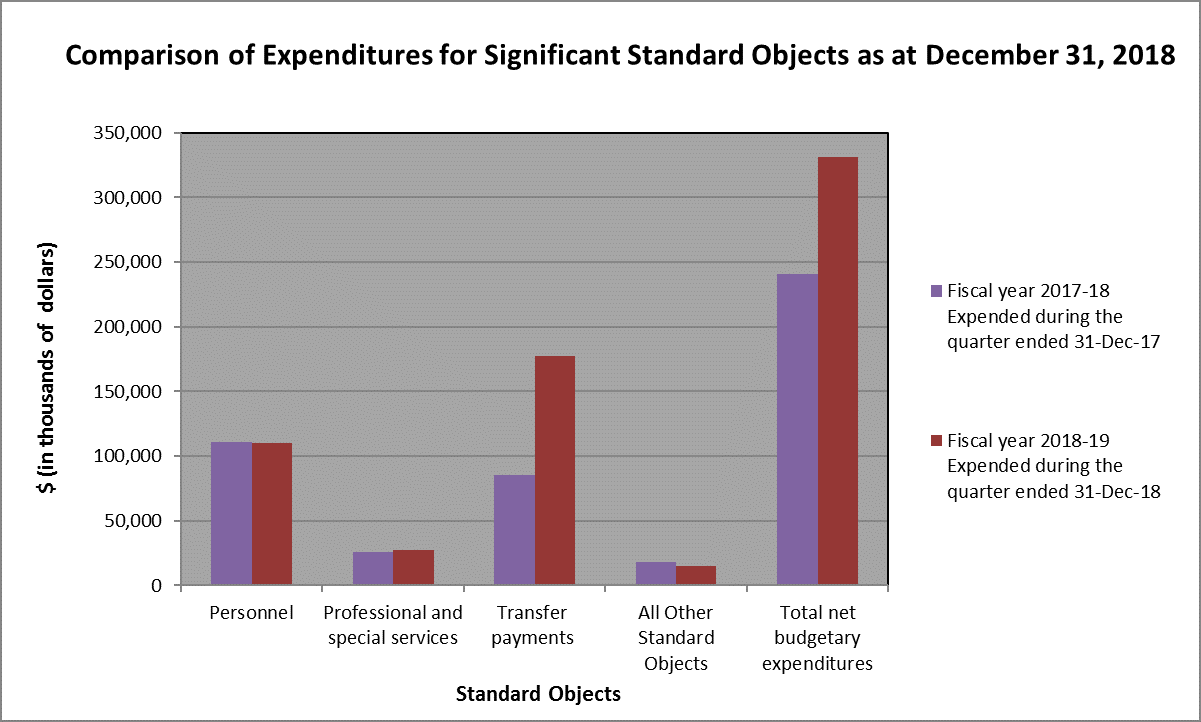
The spending for the quarter ending December 31, 2018 amounts to $330.9 million or 22% of total funding available for the fiscal year, compared to $240.9 million or 17% for the same quarter last year. This increase of $90 million in spending is mainly related to an increase in expenditures for transfer payments in 2018-19 compared to the same type of expenditures in 2017-18, partially offset by a decrease in expenditures for Acquisition of land, buildings and works in 2018-19 compared to the same type of expenditures in 2017-18. Further analysis is presented in Graph 2 below for standard objects with significant expenses. Table 2 at the end of this document presents the spending for all standard objects.
Graph 2
Text version
| (in thousands of dollars) | Fiscal year 2017-2018 Expended during the quarter ended 31-Dec-17 |
Fiscal year 2018-2019 Expended during the quarter ended 31-Dec-18 |
|---|---|---|
| Personnel | 110,880 | 110,231 |
| Professional and special services | 25,851 | 27,782 |
| Transfer payments | 85,648 | 177,551 |
| All Other Standard Objects | 18,504 | 15,339 |
| Total net budgetary expenditures | 240,883 | 330,903 |
| Standard Object | Explanation | Variance between 2018-19 and 2017-18 Q3 expenditures October 1 to December 31 |
Variance between 2018-19 and 2017-18 year-to-date expenditures April 1 to December 31 |
|---|---|---|---|
| Personnel | The decrease in year to date salary spending is mainly due to the higher expenses incurred in Q2 last year related to retroactive payments and wage increases from collective bargaining settlements. This decrease is slightly offset by increases due to new hires to support new programs. | (649) | (12,738) |
| Professional and Special Services | The increase in professional and special services is mainly due to contract renewals for existing programs, an increase in contracts related to new programs, increased services related to Information Management Technology transformation projects, as well due to increased real property repair projects in 2018-19. This is partially offset by a decrease related to FII, due to the majority of projects nearing completion. | 1,931 | 4,437 |
| Acquisition of land, buildings and works | The decrease is related to FII, due to the majority of projects nearing completion. | (4,143) | (9,167) |
| Transfer Payments | The increase is mainly attributed to Statutory Atlantic Offshore transfers as a result of higher production and oil prices compared to last year. This is partially offset by a decrease in grants and contributions compared to last year due to some programs starting to end and contribution agreements expiring. | 91,903 | 116,780 |
| All Other Standard Objects | The net increase is due to minor increases and decreases within different standard objects. | 978 | 4,040 |
| Total Variance | 90,020 | 103,352 |
3. Risks and Uncertainties
NRCan recognizes that a solid understanding of its risk environment (both internal and external) is fundamental to the delivery of its mandate and fulfilment of its core responsibilities. Risk management equips the department to respond proactively to change and uncertainty by defining and understanding its operating environment and the factors that drive risk. Risk considerations are integrated into strategic and operational decision- making, priority setting, and resource allocation in order to minimize potential negative impacts and maximize opportunities across the diverse range of services and operations. NRCan’s approach to risk management is codified in the Integrated Risk Management Policy Framework, which is aligned with the Treasury Board Framework for the Management of Risk.
Natural resources are at the nexus of Canada’s economic and environmental agendas. They confer significant large economic benefits, accounting for about 17% of Canada’s nominal Gross Domestic Product and the creation of 1.8 million jobs in 2017. Furthermore, our natural resources sectors inform Canada’s environmental performance. Our collective challenge is to set and implement a plan that will ensure the growth of the resource sectors and the achievement of our goals in terms of the reduction of our greenhouse gas emissions.
During the third quarter of 2018-19, the department focused on managing its risks to advance priorities in the areas of energy infrastructure and market access, softwood lumber; regulatory review, Canada-U.S. relations (including aluminium and steel tariffs), clean technology, Indigenous reconciliation and Budget 2018 implementation, including funding for actions to support the Pan-Canadian Framework on Clean Growth and Climate Change. During this quarter, Canada, the United States and Mexico reached an agreement on NAFTA and signed the new Canada-United States-Mexico Agreement (CUSMA).
NRCan also managed uncertainties regarding its future funding level and spending. The Department continuously tracks program spending, following best practices that comply with the Financial Administration Act and requesting the reprofiling of funds, as required, to ensure program objectives continue to be met. NRCan pro-actively engages with central agencies to manage the financial uncertainty associated with the sunsetting of specific time-limited programs. The department also continues to assess ways to realign resources to address pressures and multi-year transformation initiatives. NRCan mitigates its financial risks through scenario planning, monthly analysis of trends and forecasting in both salary and non-salary expenditures, and comprehensive quarterly reviews.
NRCan will continue to monitor and integrate risk information into strategic and operational decision-making in support of advancing the prosperity of Canada’s natural resource sectors while also achieving environmental results through sustainable practices.
4. Significant Changes in Relation to Operations, Personnel, Programs
The appointment of Shawn Tupper as the Associate Deputy Minister of Natural Resources occurred in the third quarter of 2018-19.
Original signed by :
______________________________
Christyne Tremblay
Deputy Minister
February 25, 2019
Ottawa, Canada
______________________________
Cheri Crosby, CPA
Chief Financial Officer
February 18, 2019
Ottawa, Canada
| (in thousands of dollars) | Fiscal Year 2018-19 | Fiscal Year 2017-18 | ||||
|---|---|---|---|---|---|---|
| Total available for use for the year ending March 31, 2019Table note * | Used during the quarter ended December 31, 2018 | Year-to-date used at quarter-end | Total available for use for the year ending March 31, 2018Table note ** | Used during the quarter ended December 31, 2017 | Year-to-date used at quarter-end | |
| Vote 1 - Net Operating Expenditures | 584,916 | 135,994 | 395,345 | 567,592 | 127,380 | 392,677 |
| Vote 5 - Capital Expenditures | 32,072 | 3,182 | 8,606 | 69,182 | 13,503 | 25,633 |
| Vote 10 - Grants and Contributions | 438,821 | 42,092 | 99,673 | 351,135 | 49,659 | 116,346 |
| Statutory Payments | ||||||
| Minister of Natural Resources – Salary and motor car allowance | 86 | 22 | 65 | 84 | 22 | 64 |
| Contributions to employee benefit plans | 56,614 | 13,904 | 41,710 | 54,514 | 13,350 | 40,051 |
| Spending of amounts equivalent to proceeds from disposal of surplus crown assets | - | 4 | 4 | - | 56 | 56 |
| Contribution to the Canada/Newfoundland Offshore Petroleum BoardTable note *** | 8,835 | (5,230) | (2,023) | 8,835 | (2,257) | 2,161 |
| Contribution to the Canada/Nova Scotia Offshore Petroleum BoardTable note *** | 4,355 | (977) | (414) | 4,355 | (44) | 1,045 |
| Payments to the Nova Scotia Offshore Revenue Account | 5,356 | 62,279 | 64,702 | 6,624 | 2,241 | 5,802 |
| Payments to the Newfoundland Offshore Petroleum Resource Revenue Fund | 392,507 | 79,510 | 223,227 | 387,367 | 36,973 | 143,778 |
| Crown Share Adjustment Payments for Nova Scotia Offshore Petroleum Resources | 438 | 123 | 123 | 1,818 | - | 53 |
| Total Statutory Payments | 468,191 | 149,635 | 327,394 | 463,597 | 50,341 | 193,010 |
| Total Budgetary Authorities | 1,524,000 | 330,903 | 831,018 | 1,451,506 | 240,883 | 727,666 |
| (in thousands of dollars) | Fiscal year 2018-2019 | Fiscal year 2017-2018 | ||||
|---|---|---|---|---|---|---|
| Total available for use for the year ending March 31, 2019Table note * | Expended during the quarter ended Dec 31, 2018 | Year-to-date used at Quarter-end | Total available for use for the year ending March 31, 2018Table note ** | Expended during the quarter ended December 31, 2017 | Year-to-date used at Quarter-end | |
| Budgetary Expenditures: | ||||||
| Personnel | 433,081 | 110,231 | 328,559 | 429,227 | 110,880 | 341,297 |
| Transportation and communication | 18,695 | 4,255 | 12,045 | 14,515 | 4,059 | 11,151 |
| Information | 7,045 | 1,243 | 2,851 | 5,524 | 1,303 | 3,274 |
| Professional and special services | 141,740 | 27,782 | 67,728 | 132,435 | 25,851 | 63,291 |
| Rentals | 18,550 | 2,001 | 11,618 | 33,315 | (546) | 10,739 |
| Repair and maintenance | 7,819 | 678 | 2,375 | 5,432 | 2,274 | 4,235 |
| Utilities, materials and supplies | 47,562 | 3,827 | 9,526 | 37,517 | 3,804 | 10,036 |
| Acquisition of land, buildings and works | 14,469 | 2,079 | 6,161 | 2,121 | 6,222 | 15,328 |
| Acquisition of machinery and equipment | 18,955 | 2,770 | 6,706 | 67,091 | 3,136 | 5,862 |
| Transfer payments | 850,312 | 177,551 | 385,041 | 760,133 | 85,648 | 268,261 |
| Other subsidies and payments | 2,897 | 3,123 | 10,992 | 2,661 | 3,019 | 10,670 |
| Total Budgetary Expenditures | 1,561,125 | 335,540 | 843,602 | 1,489,971 | 245,650 | 744,144 |
| Less: | ||||||
| Total Revenues Netted Against Expenditures | 37,125 | 4,637 | 12,584 | 38,465 | 4,767 | 16,478 |
| Total Net Budgetary Expenditures | 1,524,000 | 330,903 | 831,018 | 1,451,506 | 240,883 | 727,666 |