
Natural Resources Canada Quarterly Financial Report (Unaudited) for the Quarter Ended December 31, 2022
Statement outlining results, risks and significant changes in operations, personnel and programs
1. Introduction
This quarterly financial report should be read in conjunction with the Main Estimates and any Supplementary Estimates approved in a given year by the date of this report. It has been prepared by management as required by section 65.1 of the Financial Administration Act and in the form and manner prescribed by Treasury Board. This quarterly financial report has not been subject to an external audit or review.
1.1 Authority, Mandate and Programs
Natural Resources Canada (NRCan) works to improve the quality of life of Canadians by ensuring that our natural resources are developed sustainably, providing a source of jobs, prosperity, and opportunity, while preserving our environment and respecting our communities and Indigenous peoples.
Further details on NRCan’s authority, mandate and programs can be found in Part II of the Main Estimates.
1.2 Basis of Presentation
This quarterly financial report has been prepared by management using an expenditure basis of accounting. The accompanying Statement of Authorities includes NRCan’s spending authorities granted by Parliament, and those used by NRCan are consistent with the Main Estimates and Supplementary (B) for the 2022-23 fiscal year. This quarterly report has been prepared using a special purpose financial reporting framework designed to meet financial information needs with respect to the use of spending authorities.
The authority of Parliament is required before money can be spent by the Government. Approvals are given in the form of annually approved limits through appropriation acts, or through legislation in the form of statutory spending authority for specific purposes.
NRCan uses the full accrual method of accounting to prepare and present its annual unaudited departmental financial statements that are part of the departmental results reporting process. However, the spending authorities voted by Parliament remain on an expenditure basis.
2. Highlights of Fiscal Quarter and Fiscal Year-to-Date Results
This Departmental Quarterly Financial Report reflects the results as of December 31, 2022, which include Main Estimates and Supplementary Estimates (B) for which full supply was released. The details presented in this report focus on and compare the third quarter results of 2022-23 with those of 2021-22.
2.1. Authorities
As per Table 1, presented at the end of this document, and on Graph 1 below, as at December 31, 2022, NRCan has authorities available for use of $3,966.8M compared to $2,694.9M in 2021-22, for a net increase of $1,271.9M or 47.2%.
Graph 1
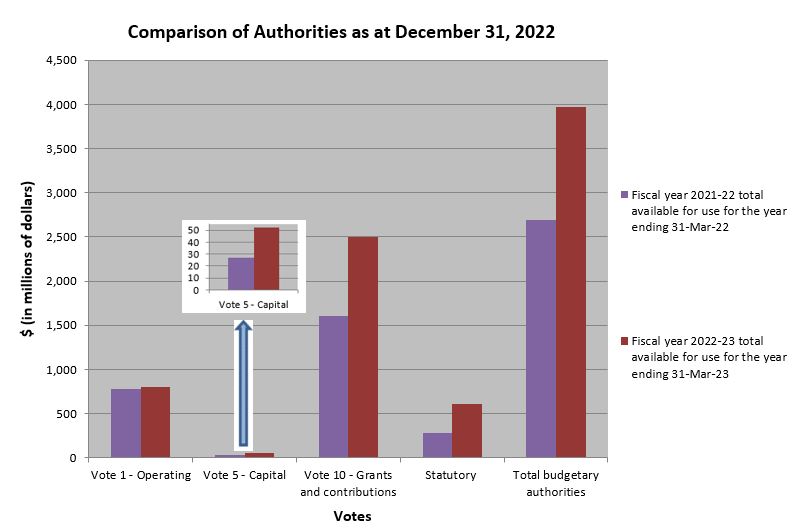
Text Version
| (in millions of dollars) | Fiscal year 2021-22 | Fiscal year 2022-23 |
|---|---|---|
| Total available for use for the year ending 31-Mar-22 |
Total available for use for the year ending 31-Mar-23 |
|
| Vote 1 - Operating | 779 | 806 |
| Vote 5 - Capital | 27 | 52 |
| Vote 10 - Grants and Contributions | 1,610 | 2,500 |
| Statutory | 279 | 609 |
| Total budgetary authorities | 2,695 | 3,967 |
The increase of $1,271.9M in authorities in 2022-23 compared to 2021-22 is explained by the net effect of fluctuations within Vote 1 operating expenditures, Vote 5 capital expenditures, Vote 10 grants and contributions, and statutory authorities, as per the following:
| Total available for use for the year ending March 31, 2022 | 2,694,898 |
| Vote 1 - Operating | |
|---|---|
| New funding | |
| Carbon Capture, Utilization and Storage | 24,633 |
| Energy System Transformation and Net Zero Growth | 16,746 |
| Clean Fuels Fund | 12,329 |
| Increased/(Decreased) Funding Profile | |
| Atomic Workers Recognition Program | 21,221 |
| Flood Hazard Identification and Mapping Program | 17,607 |
| Polar Continental Shelf Program Reinvestment | 11,491 |
| Greener Homes (Home Retrofit) | (75,269) |
| Indigenous Natural Resource Partnership | (15,952) |
| Increase in Operating Budget Carry Forward | 8,957 |
| All other net increases less than $10M individually | 5,219 |
| Sub–total Vote 1 - Operating | 26,982 |
| Vote 5 - Capital | |
| New funding | |
| Critical Minerals | 3,445 |
| Increased Funding Profile | |
| Funding to address Canadian Data Receiving Infrastructure (Budget 2021) | 13,669 |
| Increase in Capital Budget Carry Forward | 4,141 |
| All other net increases less than $3M individually | 4,147 |
| Sub–total Vote 5 - Capital | 25,402 |
| Vote 10 - Grants & Contributions | |
| New Funding | |
| Clean Fuels Fund | 348,400 |
| Decarbonization of On-road Transportation | 97,077 |
| Energy System Transformation and Net Zero Growth | 50,964 |
| Partner with Indigenous Peoples on Natural Resource Projects | 26,500 |
| Carbon Capture, Utilization and Storage | 23,250 |
| Increased/(Decreased) Funding Profile | |
| Greener Homes - Home Retrofits | 324,550 |
| Smart Renewables and Electrification Pathways Program | 208,489 |
| Natural Climate Solution Fund - 2B Tree | 136,500 |
| Encouraging Canadians to Use Zero Emission Vehicles (Top-up) | 45,165 |
| Investments in Forest Industry Transformation Program (Top-up) | 50,583 |
| Mountain Pine Beetle | 20,770 |
| Emissions Reduction Fund | (297,356) |
| Youth Employment Strategy - Green Jobs | (34,518) |
| Green Infrastructure Phase II - Emerging Renewable Power | (24,559) |
| Sunsetters | |
| Climate Change Renewal - Advancing Clean Tech - Clean Growth | (28,227) |
| Impacts Canada Fund (Clean Technology Stream) | (27,418) |
| Green Infrastructure - Phase II - Electric Vehicles & Alternative Fuel | (23,360) |
| All other net decreases less than $20M individually | (6,479) |
| Sub–total Vote 10 - Grants & Contributions | 890,331 |
| Statutory | |
| Newfoundland Offshore Petroleum Resources Revenue Fund (Forecasts are revised annually based on projected oil & natural gas production levels, prices, exchange rates and operator's costs) | 327,465 |
| All other net increases | 1,700 |
| Sub–total Statutory | 329,165 |
| Total increase from previous year due to year-over-year changes | 1,271,880 |
| Total available for use for the year ending March 31, 2023 | 3,966,778 |
2.2. Budgetary Expenditures by Standard Object
The spending for the quarter ending December 31, 2022 amounts to $516.8M or 13.0% of total funding available for the fiscal year, compared to $340.3M or 12.6% for the same quarter last year. This increase of $176.5M in spending is mainly related to an increase in expenditures for personnel, professional and special services and transfer payments in 2022-23 compared to the same type of expenditures in 2021-22. Further analysis has been done on standard objects with significant expenses, as noted in Graph 2 below. Table 2 at the end of this document presents the spending for all standard objects.
Graph 2
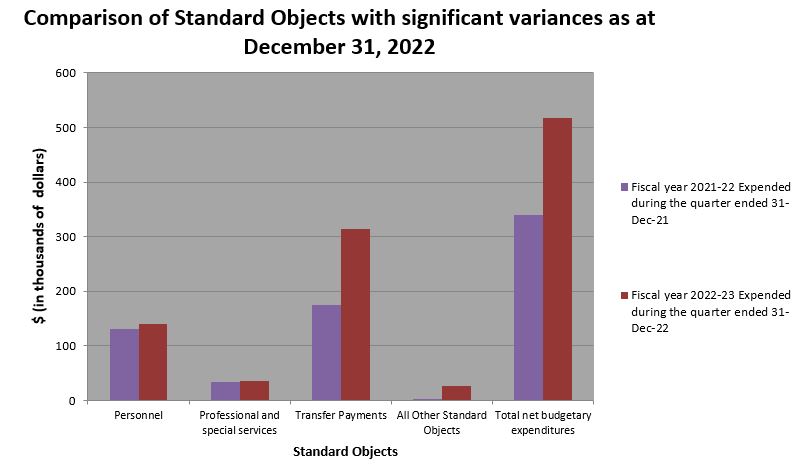
Text Version
| (in millions of dollars) | Fiscal year 2021-22 | Fiscal year 2022-23 |
|---|---|---|
| Expended during the quarter ended 31-Dec-21 | Expended during the quarter ended 31-Dec-22 | |
| Personnel | 131 | 141 |
| Professional and special services | 33 | 36 |
| Transfer payments | 175 | 314 |
| All Other Standard Objects | 1 | 26 |
| Total net budgetary expenditures | 340 | 517 |
| Standard Object | Explanation | Variance between 2022-23 and 2021-22 Q3 expenditures | Variance between 2022-23 and 2021-22 YTD expenditures |
|---|---|---|---|
| Personnel | The increase is mainly due incremental hires to support new/recent programs such as Energy System Transformation and Net Zero Growth, Greener Homes, Carbon Capture, Utilization and Storage (CCUS), Clean Fuels Fund, Atomic Workers Recognition Program, etc. | 9,641 | 28,817 |
| Professional and special services | The increase is mainly due to incremental spending to support new/recent programs such as Critcal Minerals, Greener Homes, Fighting and Managing Wildfires in a Changing Climate, Forest Mapping and Energy System Transformation and Net Zero Growth (Electricity Pre-Development Projects); increased cost for IT and building modernization to facilitate the Future of Work; translation services for the Offshore Committee Official Language program (OCOL); increased spending due to the lifting of travel restrictions in 2022-23 as well as contracts that were deferred from 2021-22. | 3,184 | 19,993 |
| Transfer Payments | The increase is mainly attributed to new spending for Smart Renewable and Electrification Pathways program as significant expenses were incurred for approved construction projects; increased grant spending for Greener Homes; and transfers in the form of royalties & forfeitures to the Offshore Accounts; offset by sunsetting programs, late funding approval or reduced funding initiatives such as Impact Canada Initiative, Clean Growth Program, Spruce Budworm and Green Jobs/Science and Technology Internship Program. | 139,200 | 238,631 |
| Other subsidies and payments | The increase is mainly related to disbursements of ex-gratia payments for the Atomic Workers Recognition Program, and timing of OGD transfers expected to occur in the next quarter. | 17,564 | 9,911 |
| All Other Standard Objects | Represents minor increases and/or decreases across all other Standard Objects. | 6,920 | 19,939 |
| Total Variance | 176,509 | 317,292 | |
3. Risks and Uncertainties
Canada’s vast natural resource sectors contribute significantly to economic growth across the country and play a vital role in creating jobs, fostering growth and prosperity for Canadians. In addition, Canada continues to support international focus on adaptation actions to build capacity to adapt to the impacts of a changing climate. NRCan continues to work with other government departments and central agencies to address risks that have an impact on the natural resources sector while strengthening the economy.
The consequences of the COVID-19 pandemic and the war in Ukraine have continued to cause severe impacts and disruptions to the global economy and exposed the Canadian natural resources sector to a higher degree of uncertainty. One of the biggest impacts on the Canadian natural resources economy is the elevated commodity prices, combined with persistent inflation, high interest rates and labour shortages across the country, in the context of an expected economic slowdown. Between the higher cost of living, supply chain issues, China’s economic concerns, declining household wealth and monetary tightening, Canadian economic activity is still facing and dealing with a variety of significant challenges as it moves ahead.
Real GDP of the natural resources sector edged up 0.9% in the third quarter of 2022 relative to the previous quarter. In contrast, the economy-wide real GDP rose 0.7%. Oil sands extraction led the way in the energy subsector, owed to increased production of crude bitumen in Alberta despite maintenance activity. The gain in the mineral and mining subsector was driven in part by increased potash mining, as exports of the commodity have grown strongly following Russia's invasion of Ukraine. The forestry subsector was impacted by reduced housing market activity and higher interest rates, which put downward pressure on lumber demand and prices. As for the employment level, the natural resources sector rose 0.3% in the third quarter of 2022 compared to a 0.3% reduction across the entire Canadian economy. In OECD’s Economic Outlook, Canadian real GDP growth is projected to slow from 3.2% this year to 1% in 2023, due to higher borrowing costs, deteriorating conditions abroad and labour market pressures.
The Government of Canada’s Budget 2022 investments have positioned NRCan to continue to assist in laying the foundation for Canada’s transition to net-zero by 2050, from clean energy to critical minerals to combatting wildfires. For example, in collaboration with partners, NRCan initiatives contribute to strengthening energy efficiency and climate resilience for Canadian homes, investing in natural resources workers and the creation of inclusive green jobs to bolster the economy, advancing net-zero electricity generation, enhancing critical minerals development, building new wildfire monitoring satellite systems, and supporting Indigenous partnerships, capacity building and benefits sharing.
NRCan continues to manage internal and external risks to deliver its mandate and core responsibilities. Internal processes continue to strengthen the integration of risk management, risk mitigation, priority setting and decision-making to support results delivery, including assessment and monitoring of strategic and operational risks. As Canada transitions to a low-carbon economy, NRCan also looks to ensure that its programs, policies, and processes are inclusive by design and address systemic barriers. Inclusion, diversity, equity, and accessibility are key outcomes that NRCan strives to integrate and achieve moving ahead in 2023. NRCan continues to foster inclusive growth in the natural resource sectors and to remain fully committed to advancing reconciliation, collaboration, and partnerships with Indigenous Peoples in the natural resource sectors.
Moving ahead into a post-pandemic world, NRCan has also coordinated plans on the future of work and continues advancing business continuity and a safe work environment as it sees employees returning to the office. Improvements have been made, for example by upgrading NRCan’s technology and modernizing the current workspace, as well as collaborating with other government departments to ensure that NRCan has the tools in place to track and manage work arrangements in a consistent way.
Managing risks and uncertainties remain a high priority for the Department going forward. NRCan will continue to monitor risks to inform decision-making and priority setting, while continuing to support Canadians and the natural resources sector in 2022-23 and beyond.
4. Significant Changes in Relation to Operations, Personnel, Programs
During the 3rd quarter of 2022-23, senior management announced that Brenda Dogbey would assume the leadership of the office of Inclusion, Diversity, Equity and Accessibility (IDEA), effective November 28, 2022.
In addition, NRCan is continuing its transition toward a hybrid work model that is flexible, productive, agile and inclusive to enable work–life balance while maximizing efficiency and effectiveness; achieve greater diversity and be more regionally inclusive; and provide access to talent and skills from across Canada.
Original signed by:
John F.G. Hannaford
Deputy Minister
Date signed
February 27, 2023
Ottawa, Canada
Original signed by:
Shirley Carruthers, CPA, CGA
Chief Financial Officer
Date signed
February 22, 2023
Ottawa, Canada
| (in thousands of dollars) | Fiscal Year 2022-23 | Fiscal Year 2021-22 | ||||
|---|---|---|---|---|---|---|
| Total available for use for the year ending March 31, 2023* | Expended during the quarter ended December 31, 2022 | Year-to-date used at quarter-end | Total available for use for the year ending March 31, 2022** | Expended during the quarter ended December 31, 2021 | Year-to-date used at quarter-end | |
| Vote 1 - Net Operating Expenditures | 806,326 | 182,530 | 505,863 | 779,344 | 146,235 | 432,243 |
| Vote 5 - Capital Expenditures | 52,071 | 4,192 | 8,590 | 26,669 | 4,130 | 6,383 |
| Vote 10 - Grants and Contributions | 2,499,895 | 188,662 | 376,827 | 1,609,564 | 116,284 | 220,292 |
| Statutory Payments | ||||||
| Minister of Natural Resources – Salary and motor car allowance | 93 | 23 | 69 | 91 | 23 | 68 |
| Contributions to employee benefit plans | 67,713 | 16,041 | 48,124 | 63,389 | 15,106 | 45,317 |
| Contribution to the Canada/Newfoundland Offshore Petroleum Board | 11,187 | (4,947) | (2,433) | 11,677 | (2,205) | 149 |
| Contribution to the Canada/Nova Scotia Offshore Petroleum Board | 2,693 | 327 | 1,518 | 3,932 | (266) | 1,080 |
| Payments to the Nova Scotia Offshore Revenue Account | - | 717 | 19,438 | - | - | - |
| Payments to the Newfoundland Offshore Petroleum Resource Revenue Fund | 526,800 | 129,248 | 297,528 | 199,335 | 60,776 | 232,508 |
| Spending of amounts equivalent to proceeds from disposal of surplus crown assets | - | 48 | 73 | - | 31 | 47 |
| Climate Action Support | - | - | - | 897 | 218 | 218 |
| Total Statutory Payments | 608,486 | 141,457 | 364,317 | 279,321 | 73,683 | 279,387 |
| Total Budgetary Authorities | 3,966,778 | 516,841 | 1,255,597 | 2,694,898 | 340,332 | 938,305 |
* Total available for use includes only authorities available for use and granted by Parliament at quarter-end through the Main Estimates and Supplementary Estimates (B), for which full supply was released.
** Total available for use includes only authorities available for use and granted by Parliament at quarter-end through the Main Estimate and Supplementary Estimates (A) and (B), for which full supply was released.
| (in thousands of dollars) | Fiscal Year 2022-23 | Fiscal Year 2021-22 | ||||
|---|---|---|---|---|---|---|
| Total available for use for the year ending March 31, 2023* | Expended during the quarter ended December 31, 2022 | Year-to-date used at quarter-end | Total available for use for the year ending March 31, 2022** | Expended during the quarter ended December 31, 2021 | Year-to-date used at quarter-end | |
| Budgetary Expenditures: | ||||||
| Personnel | 513,154 | 140,720 | 409,455 | 497,591 | 131,079 | 380,638 |
| Transportation and communication | 26,217 | 4,135 | 9,262 | 34,312 | 1,505 | 3,756 |
| Information | 32,265 | 2,627 | 6,065 | 20,775 | 1,998 | 4,824 |
| Professional and special services | 216,414 | 36,168 | 89,468 | 207,953 | 32,984 | 69,475 |
| Rentals | 32,577 | 3,748 | 16,717 | 33,520 | 3,566 | 14,577 |
| Repair and maintenance | 12,169 | 839 | 1,666 | 11,069 | 711 | 2,351 |
| Utilities, materials and supplies | 42,355 | 3,786 | 9,319 | 41,323 | 3,796 | 7,642 |
| Acquisition of land, buildings and works | 8,886 | 1,521 | 2,796 | 6,144 | 1,590 | 2,402 |
| Acquisition of machinery and equipment | 65,520 | 6,995 | 15,076 | 44,866 | 4,063 | 7,679 |
| Transfer payments | 3,040,574 | 314,007 | 692,878 | 1,825,406 | 174,807 | 454,247 |
| Other subsidies and payments | 14,821 | 8,546 | 16,758 | 8,800 | (9 018) | 6,847 |
| Total Budgetary Expenditures | 4,004,952 | 523,092 | 1,269,460 | 2,731,760 | 347,081 | 954,438 |
| Less: Total Revenues Netted Against Expenditures | 38,174 | 6,251 | 13,863 | 36,861 | 6,749 | 16,133 |
| Total Net Budgetary Expenditures | 3,966,778 | 516,841 | 1,255,597 | 2,694,898 | 340,332 | 938,305 |
* Total available for use includes only authorities available for use and granted by Parliament at quarter-end through the Main Estimates and Supplementary Estimates (B), for which full supply was released.
** Total available for use includes only authorities available for use and granted by Parliament at quarter-end through the Main Estimate and Supplementary Estimates (A) and (B), for which full supply was released.
Page details
- Date modified: