Image Classification and Analysis

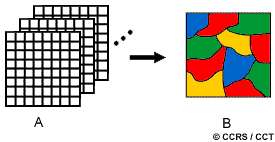
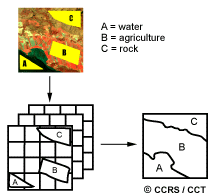
A human analyst attempting to classify features in an image uses the elements of visual interpretation (discussed in section 4.2) to identify homogeneous groups of pixels which represent various features or land cover classes of interest. Digital image classification uses the spectral information represented by the digital numbers in one or more spectral bands, and attempts to classify each individual pixel based on this spectral information. This type of classification is termed spectral pattern recognition. In either case, the objective is to assign all pixels in the image to particular classes or themes (e.g. water, coniferous forest, deciduous forest, corn, wheat, etc.). The resulting classified image is comprised of a mosaic of pixels, each of which belong to a particular theme, and is essentially a thematic "map" of the original image.
When talking about classes, we need to distinguish between information classes and spectral classes. Information classes are those categories of interest that the analyst is actually trying to identify in the imagery, such as different kinds of crops, different forest types or tree species, different geologic units or rock types, etc. Spectral classes are groups of pixels that are uniform (or near-similar) with respect to their brightness values in the different spectral channels of the data. The objective is to match the spectral classes in the data to the information classes of interest. Rarely is there a simple one-to-one match between these two types of classes. Rather, unique spectral classes may appear which do not necessarily correspond to any information class of particular use or interest to the analyst. Alternatively, a broad information class (e.g. forest) may contain a number of spectral sub-classes with unique spectral variations. Using the forest example, spectral sub-classes may be due to variations in age, species, and density, or perhaps as a result of shadowing or variations in scene illumination. It is the analyst's job to decide on the utility of the different spectral classes and their correspondence to useful information classes.

Common classification procedures can be broken down into two broad subdivisions based on the method used: supervised classification and unsupervised classification. In a supervised classification, the analyst identifies in the imagery homogeneous representative samples of the different surface cover types (information classes) of interest. These samples are referred to as training areas. The selection of appropriate training areas is based on the analyst's familiarity with the geographical area and their knowledge of the actual surface cover types present in the image. Thus, the analyst is "supervising" the categorization of a set of specific classes. The numerical information in all spectral bands for the pixels comprising these areas are used to "train" the computer to recognize spectrally similar areas for each class. The computer uses a special program or algorithm (of which there are several variations), to determine the numerical "signatures" for each training class. Once the computer has determined the signatures for each class, each pixel in the image is compared to these signatures and labeled as the class it most closely "resembles" digitally. Thus, in a supervised classification we are first identifying the information classes which are then used to determine the spectral classes which represent them.

Unsupervised classification in essence reverses the supervised classification process. Spectral classes are grouped first, based solely on the numerical information in the data, and are then matched by the analyst to information classes (if possible). Programs, called clustering algorithms, are used to determine the natural (statistical) groupings or structures in the data. Usually, the analyst specifies how many groups or clusters are to be looked for in the data. In addition to specifying the desired number of classes, the analyst may also specify parameters related to the separation distance among the clusters and the variation within each cluster. The final result of this iterative clustering process may result in some clusters that the analyst will want to subsequently combine, or clusters that should be broken down further - each of these requiring a further application of the clustering algorithm. Thus, unsupervised classification is not completely without human intervention. However, it does not start with a pre-determined set of classes as in a supervised classification.
Did you know?
"...this image has such lovely texture, don't you think?..."

...texture was identified as one of the key elements of visual interpretation (section 4.2), particularly for radar image interpretation. Digital texture classifiers are also available and can be an alternative (or assistance) to spectral classifiers. They typically perform a "moving window" type of calculation, similar to those for spatial filtering, to estimate the "texture" based on the variability of the pixel values under the window. Various textural measures can be calculated to attempt to discriminate between and characterize the textural properties of different features.
Whiz quiz

You want to perform a classification on a satellite image, but when examining its histogram, you notice that the range of useful data is very narrow. Prior to attempting classification, would you enhance the image with a linear contrast stretch?
The answer is ...
Whiz quiz - answer
An 'enhancement' of an image is done exclusively for visually appreciating and analyzing its contents. An enhancement would not add anything useful, as far as the classification algorithm is concerned. Another way of looking at this is: if two pixels have brightness values just one digital unit different, then it would be very difficult to notice this subtle difference by eye. But for the computer, the difference is just as 'obvious' as if it was 100 times greater.

An enhanced version of the image may help in selecting 'training' sites (by eye), but you would still perform the classification on the unenhanced version.
Page details
- Date modified: