Geologic Unit Mapping
Background
Mapping geologic units consists primarily of identifying physiographic units and determining the rock lithology or coarse stratigraphy of exposed units. These units or formations are generally described by their age, lithology and thickness. Remote sensing can be used to describe lithology by the colour, weathering and erosion characteristics (whether the rock is resistant or recessive), drainage patterns, and thickness of bedding.
Unit mapping is useful in oil and mineral exploration, since these resources are often associated with specific lithologies. Structures below the ground, which may be conducive to trapping oil or hosting specific minerals, often manifest themselves on the Earth's surface. By delineating the structures and identifying the associated lithologies, geologists can identify locations that would most feasibly contain these resources, and target them for exploration. Bedrock mapping is critical to engineering, construction, and mining operations, and can play a role in land use and urban planning. Understanding the distribution and spatial relationships of the units also facilitates interpretation of the geologic history of the Earth's surface.
In terms of remote sensing, these "lithostratigraphic" units can be delineated by their spectral reflectance signatures, by the structure of the bedding planes, and by surface morphology.
Why remote sensing?
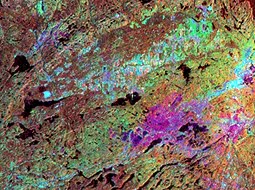
Remote sensing gives the overview required to 1) construct regional unit maps, useful for small scale analyses, and planning field traverses to sample and verify various units for detailed mapping; and 2) understand the spatial distribution and surface relationships between the units. VIR remote sensing provides the multispectral information relating to the composition of the unit, while radar can contribute textural information. Multiple data sources can also be integrated to provide a comprehensive view of the lithostratigraphy.
Stereo imagery can also facilitate delineation and identification of units by providing a three dimensional view of the local relief. Some rocks are resistant to erosion, whereas others erode easily. Identification elements such as weathering manifestations may be apparent on high or medium resolution imagery and airphotos.
Images or airphotos can be taken into the field and used as basemaps for field analysis.
Data requirements
Two different scales of mapping require slightly different imaging sources and parameters.
- For site specific analysis, airphotos provide a high resolution product that can provide information on differential weathering, tone, and microdrainage. Photos may be easily viewed in stereo to assess relief characteristics.
- Regional overviews require large coverage area and moderate resolution. An excellent data source for regional applications is a synergistic combination of radar and optical images to highlight terrain and textural information.
In either case, frequency of imaging is not an issue since in many cases the geological features of interest remain relatively static. Immediate turnaround is also not critical.
Canada vs. International
Requirements for this application do not differ significantly around the world. One of the biggest problems faced by both temperate and tropical countries is that dense forest covers much of the landscape. In these areas, geologists can use remote sensing to infer underlying lithology by the condition of vegetation growing above it. This concept is called "geobotany". The underlying principle is that the mineral and sedimentary constituents of the bedrock may control or influence the condition of vegetation growing above.

In reality, the topography, structure, surficial materials, and vegetation combine to facilitate geologic unit interpretation and mapping. Optimal use of remote sensing data therefore, is one that integrates different sources of image data, such as optical and radar, at a scale appropriate to the study.
Image example
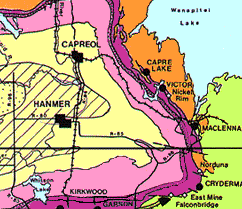
Even once geological unit maps are created, they can still be presented more informatively by encompassing the textural information provided by SAR data. A basic geological unit map can be made more informative by adding textural and structural information. In this example of the Sudbury, Ontario region, an integration transform was used to merge the map data (bedrock and structural geology information, 1992) with the SAR image data. The resulting image can be used on a local or regional scale to detect structural trends within and between units. The areas common to each image are outlined in black.

Page details
- Date modified: