Regional Overview
2.1 PHYSICAL GEOGRAPHY
Physiography
Northern Canada includes five major physiographic regions: Canadian Shield, Interior Plains, Arctic Lowlands, Cordillera and Innuitian Region (Figure 2; Fulton, 1989). The Canadian Shield dominates the eastern and central portions of the Arctic mainland, and the eastern portions of the Arctic Archipelago. Rolling terrain contains a maze of lakes and rivers and a high proportion of exposed bedrock, while the mountainous terrain of Baffin Island features glaciers and ice fields. The Interior Plains lie to the west of the Canadian Shield and comprise a series of low-lying plateaus and extensive wetlands. The Arctic Lowlands, which form part of the Arctic Archipelago, lie between the Canadian Shield and the Innuitian Region. This region contains lowland plains with glacial moraines in the west and uplands with plateaus and rocky hills in the east. The complex terrain of the Cordillera lies immediately west of the Interior Plains and encompasses steep mountainous terrain with narrow valleys, plateaus and plains. Extensive ice fields and many of the highest peaks in North America are found in the St. Elias Mountains on the Yukon Pacific coast (Prowse, 1990; French and Slaymaker, 1993). The Innuitian Region encompasses the Queen Elizabeth Islands, the most northern and remote area of the country.
Consideration of physiography, together with regional differences in climate, vegetation and wildlife, allow definition of eight ecoregions in the North (Furgal et al., 2003), which are depicted and described in Figure 2.
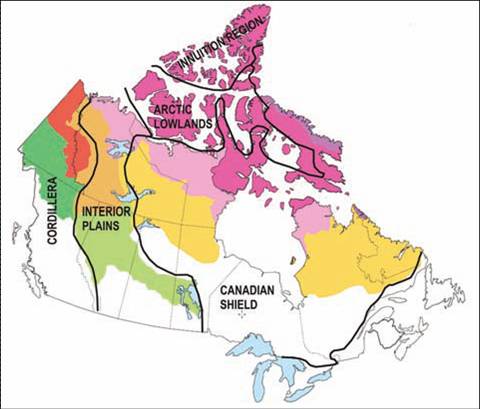
FIGURE 2: Physiographic regions (from Fulton, 1989) and ecoregions of the Canadian North (Furgal et al., 2003).
text version
Figure 2
The five major physiographic regions of Northern Canada consist of several smaller ecozones: Arctic Cordillera, Northern Arctic, Southern Arctic, Taiga Plains, Taiga Shield, Taiga Cordillera, Boreal Plains, and Boreal Cordillera.
The Arctic Cordillera covers the northern tip of Labrador and runs along the northeastern coast of Baffin Island, Nunavut. The Northern Arctic encompasses almost the entirety of the Arctic Archipelago as well as northeastern Nunavut and northern Quebec, while the Southern Arctic covers northern portions of the Northwest Territories, Nunavut and Quebec. The Taiga Plains cover northern sections of British Columbia, Alberta, and the Yukon, as well as the western half of the Northwest Territories. Situated to the east are the Taiga Plains, which stretch across Canada covering portions of northern Manitoba, Saskatchewan, and Alberta, the eastern half of the Northwest Territories and southern Nunavut, as well as central Quebec and Labrador. The Taiga Cordillera covers most of the northern half of Yukon and extends slightly into the Northwest Territories. The Boreal Plains encompass the northern half of Alberta and stretch across the middle of Saskatchewan, extending slightly into Manitoba and the Boreal Cordillera covers sections of northern British Columbia and southern Yukon.
Climate
Northern Canada is characterized by long cold winters interrupted by short cool summers. Precipitation is light and concentrated in the warmer months. Mean annual temperatures (1971 –2000) range from approximately –1 to –5°C in more southerly regions of the Canadian Arctic to near –18°C in the islands of the high Arctic. On a seasonal basis, average winter temperatures range from around –37°C in the north to –18°C in the south, and summer values from +6 to +16°C (Environment Canada, 2006). Within these averages, there exists a high degree of variability on intraseasonal, interannual and interdecadal scales (Bonsal et al., 2001a).
Northern Canada receives relatively low amounts of precipitation, particularly at very high latitudes. Annual values typically range from 100 to 200 mm over the islands of the high Arctic to nearly 450 mm in the southern Northwest Territories. Higher precipitation occurs over the east coast of Baffin Island (600 mm/a) and the Yukon, where annual amounts can range from approximately 400 to 500 mm in southeastern areas to more than 1000 mm in the extreme southwest (Phillips, 1990).
Mean annual evaporation decreases from approximately 250 to 400 mm at latitude 60°N to less than 100 mm in the central portions of the Arctic Archipelago (den Hartog and Ferguson, 1978). Evaporation is greatest during the summer, especially in areas of low relief characterized by numerous bogs and lakes. On large deep bodies of water, such as Great Slave Lake, heat stored from the summer months continues to produce significant evaporation during the fall (Oswald and Rouse, 2004). North of the wetland and forested zones, transpiration decreases because of the lower vegetation density and the increasing proportion of mosses and lichens. However, the relative importance of evapotranspiration in the overall water balance tends to increase northward because of the more rapid decrease in precipitation. Moisture loss to the atmosphere also occurs through sublimation of snow and ice (Pomeroy et al., 1998).
Permafrost
The term ‘permafrost' refers to earth materials that remain below 0°C for two consecutive summers. The permafrost region covers about half of the Canadian landmass (Figure 1). In more northerly areas, permafrost is continuous and may be several hundred metres thick (Heginbottom et al., 1995; Smith et al., 2001a). Southward, its distribution becomes discontinuous and patchy, and it is only a few metres thick at the southern fringe of the permafrost region. Subsea permafrost is also found offshore in parts of the Canadian Arctic.
The presence of permafrost and associated ground ice strongly influence the properties and performance of earth materials, landscape processes and surface and subsurface hydrology, and also control much land and property development. Permafrost restricts infiltration of water and has led to the formation of extensive wetlands and peatlands in areas of low relief (e.g. Brown et al., 2004; Mackenzie River Basin Board, 2004). Differential thawing of ice-rich permafrost results in hummocky or thermokarst topography. Runoff response in permafrost regions is controlled by the depth of the seasonal thaw (active) layer, which may exist for as little as 2 months.
Water
Eighteen per cent of Canada's fresh water is found north of latitude 60°N, primarily in lakes (e.g. Great Bear and Great Slave lakes) on the mainland Canadian Shield of the Northwest Territories and Nunavut (Prowse, 1990). This percentage does not include the extensive glacierized areas that total in excess of 150 000 km2 on the islands of the Arctic Archipelago and 15 000 km2 on the territorial mainland. Twenty per cent of Canada's wetland area is found in the Arctic (Hebert, 2002). Runoff in the North is strongly influenced by snowmelt and/or glacier ablation (Woo, 1993).
Freshwater ice seasonally covers all lakes and rivers in the Northern Canada, with mean thickness in excess of 2 m on lakes at the highest latitudes. Duration of river-ice coverage is less than that of lake ice because rivers freeze up later in the year and are first to break up in the spring. Complete clearance of lake ice does not always occur in the far North, and multi-year ice develops on some lakes because of the brevity of the melt season. Multi-year ice accretions can also be found in the extreme North, where groundwater flow has contributed to the development of exceedingly thick surface ice.
Northern rivers are a major source of fresh water to the Arctic Ocean and contribute to the thermohaline circulation of the world's oceans, a regulator of global climate (Carmack, 2000). The dominant hydrological system in the North is the Mackenzie River, the largest river basin in Canada (1 805 200 km2). The Yukon River drains approximately three-quarters of the Yukon as it flows northwest into Alaska (Prowse, 1990).
Marine Environment
Canada's northern seas consist of the Arctic Ocean, Beaufort Sea, Hudson Bay, Foxe Basin, Baffin Bay and various channels and straits between the islands of the Arctic Archipelago. The most striking characteristic of these waters is the seasonal to multi-year cover of sea ice, often several metres thick. Permanent pack ice occurs in the central Arctic Ocean. Open water develops in the late summer off the west coast of Banks Island and in the Beaufort Sea. Farther south, Hudson Bay freezes by the end of December and begins to clear in July. Overall, the distribution and thickness of sea ice are extremely variable. Of ecological importance are open-water areas during the winter, called polynas, that occur in the Beaufort Sea, Arctic Archipelago and northern Baffin Bay (Barry, 1993).
The Arctic Ocean is connected to the Atlantic Ocean via the Greenland and Norwegian seas, as well as by numerous channels through the Arctic Archipelago to Baffin Bay and the Labrador Sea. A dominant influence on the circulation of the Arctic Ocean and pack-ice cover is the Beaufort Gyre, which results in clockwise circulation and ice movement in the Canada Basin of the Arctic Ocean. Apart from landfast ice within archipelagos and along coastlines, the sea ice is in constant motion. The movement of the marine waters and presence of extensive ice packs exert a strong influence on the climate of Canada's northern landmass (Serreze and Barry, 2005).
2.2 SOCIOECONOMIC, HEALTH AND DEMOGRAPHIC CONDITIONS AND TRENDS
Population
A little more than 100 000 people live in Northern Canada. Nearly two-thirds of northern communities are located along coastlines. The majority of Arctic communities (inland and coastal) have less than 500 residents, and these small communities together represent only 11% of the total northern population (Bogoyavlenskiy and Siggner, 2004). Only the three territorial capitals, Whitehorse, Yellowknife and Iqaluit, have populations exceeding 5000. Although Whitehorse (population 23 511 in 2005) accounts for approximately 73% of the total population of the Yukon, more than two-thirds of people in Nunavut live in communities of less than 1000 people.
The region has experienced significant demographic, social, economic and political change in recent decades, with maximum growth associated with an increase in the non-Aboriginal population, related primarily to resource development and the increase in public administration (Bogoyavlenskiy and Siggner, 2004; Chapin et al., 2005). Most growth since the establishment of communities has occurred in the three main urban centres (Einarsson et al., 2004). Over the next 25 years, greatest growth is projected in the Northwest Territories (Table 1), partly as a result of industrial development associated with the Mackenzie Valley pipeline project and new mining developments.
| 2005 population (thousands) | Projected population in 20311 (thousands) |
Mean annual growth rate1 (rate per thousand) |
|
|---|---|---|---|
| Canada | 32 270.5 | 39 024.4 | 7.3 |
| Nunavut | 30.0 | 33.3 | 4.0 |
| Northwest Territories | 43.0 | 54.4 | 9.1 |
| Yukon | 31.0 | 34.0 | 3.6 |
1 The population growth scenario assumes medium growth and medium migration rates with medium fertility, life expectancy, immigration and interprovincial migration (see scenario 3 in Statistics Canada, 2005b).
The average age of northern residents is younger than for Canada as a whole (Table 2), and more than 50% of residents in Nunavut are less than 15 years old. Projections for the next 25 years indicate that the population in Northern Canada will remain young, but have a growing proportion of people over the age of 65, increasing dependency ratios across the territories (Table 2).
| Indicator | Canada current (projected) | Yukon current (projected) | Northwest Territories current (projected) | Nunavut current (projected) |
|---|---|---|---|---|
| Median age | 38.8 (44.3) | 37.6 (40.7) | 30.8 (35.7) | 23.0 (24.5) |
| Percentage aged 0–14 | 24.9 (23.5) | 23.9 (25.0) | 33.7 (31.3) | 54.3 (50.9) |
| Percentage aged 65 and over | 19.0 (37.7) | 9.8 (30.8) | 6.9 (23.5) | 4.4 (9.1) |
| Total dependency ratio | 43.9 (61.3) | 33.6 (55.8) | 40.6 (54.8) | 58.7 (60.0) |
Just over half of northern residents are Aboriginal and represent diverse cultural and language groups, from the fourteen Yukon First Nations in the west to the Inuit of Nunavut in the east, many of whom have been in these regions for thousands of years. Non-Aboriginal residents account for 15 and 78% of the total population in Nunavut and the Yukon, respectively (Table 3; Statistics Canada, 2001). The majority of small communities are predominantly Aboriginal in composition and are places where various aspects of traditional ways are still strong components of daily life.
| Indicator | Canada | Yukon | Northwest Territories | Nunavut |
|---|---|---|---|---|
| Population density (per km2) | 3.33 | 0.06 | 0.03 | 0.01 |
| Percentage of population that is urban1 | 79.6 | 58.7 | 58.3 | 32.4 |
| Percentage of population that is Aboriginal2 | 3.4 | 22.9 | 50.5 | 85.2 |
1 Urban areas are those continuously built-up areas having a population concentration of 1000 or more and a population density of 400 or more per square kilometre based on the previous census; rural areas have concentrations or densities below these thresholds.
2 Aboriginal people are those persons who reported identifying with at least one Aboriginal group (e.g., North American Indian, Métis or Inuit) and/or those who reported being a Treaty Indian or a Registered Indian as defined by the Indian Act and/or those who were members of an Indian Band or First Nation.
Health Status
The health status of northern Canadians is lower than the national average, as measured by a number of health indicators (Table 4; Statistics Canada, 2001). All territories report lower life expectancy and higher infant mortality rates than the national averages, and these disparities are particularly pronounced in Nunavut (Table 4). The health status of Aboriginal northerners is, for many indicators, significantly below that of non-Aboriginal northern residents and the national average. Higher rates of mortality from suicide, lung cancer, drowning and unintentional injuries (i.e. accidents) associated with motor vehicle accidents occur in the North relative to the rest of the country (Table 5; Statistics Canada, 2001). Accidental deaths and injuries are likely associated, in part, with the increased exposure associated with the amount of time spent ‘on the land' and the high level of dependence on various modes of transport for hunting, fishing and collection of other resources, which are a strong part of livelihoods and life in the North.
| Indicator | Canada | Yukon | Northwest Territories | Nunavut |
|---|---|---|---|---|
| Public health spending per capita ($) | 2535 | 4063 | 5862 | 7049 |
| Life expectancy at birth (males, 2002) | 75.4 | 73.9 | 73.2 | 67.2 |
| Life expectancy at birth (females, 2002) | 81.2 | 80.3 | 79.6 | 69.6 |
| Life expectancy at age 65 (males, 2002) | 17.1 | 15.6 | 14.5 | 16.3 |
| Life expectancy at age 65 (females, 2002) | 20.6 | 19.5 | 19.2 | 11.4 |
| Infant mortality rate (per 1000 live births, 500 g or more, 2001) | 4.4 | 8.7 | 4.9 | 15.6 |
| Low birth weight rate (% of births less than 2500 g) | 5.5 | 4.7 | 4.7 | 7.6 |
| Potential years of life lost due to unintentional injury (deaths per 100 000) | 628 | 1066 | 1878 | 2128 |
| Self-reported health (percentage aged 12 and over reporting very good or excellent health)1 | 59.6 | 54 | 54 | 51 |
| Physical activity (% aged 12 and over reporting physically active or moderately active)1 | 42.6 | 57.9 | 38.4 | 42.9 |
1 Population aged 12 and over reporting level of physical activity, based on their responses to questions about the frequency, duration and intensity of their participation in leisure-time physical activity.
| Indicator | Canada | Yukon | Northwest Territories | Nunavut |
|---|---|---|---|---|
| Major cardiovascular diseases | 233.2 | 111.3 | 118.5 | 78.9 |
| Acute myocardial infarction | 58.9 | 6.5 | 35.5 | 10.3 |
| Heart attacks | 52.1 | 37.1 | 28 | 3.7 |
| Lung cancer | 48.2 | 73.2 | 61 | 209.5 |
| Accidents, unintentional injuries | 28.6 | 65.5 | 59.2 | 30.9 |
| Transport accidents (motor vehicle, other land transport, water, air and unspecified) | 9.9 | 19.6 | 16.6 | 27.5 |
| Accidental drowning | 0.8 | 9.8 | 7.1 | <0.5 |
| Intentional self-harm (suicide) | 11.9 | 19.6 | 23.7 | 106.4 |
Socioeconomic Status
The economies of many northern communities are a mix of traditional land-based renewable resource –subsistence activities and formal wage-earning activities. Estimates of Nunavut's land-based economy are between $40 and 60 million per year, with an estimated $30 million attributed to all food-oriented economic activity (Conference Board of Canada, 2005). However, the true value of such activities is difficult to measure, as they are significant contributions to the social fabric of communities and provide more than monetary benefits. The traditional economy is similarly important in other northern regions (Duhaime et al., 2004). For example, more than 70% of northern Aboriginal adults reported harvesting natural resources via hunting and fishing and, of those, more than 96% did so for subsistence purposes (Statistics Canada, 2001).
Wage-earning activities are often tied to non-renewable resource extraction or to public administration, which is the largest economic sector in many regions (e.g. 22% of territorial gross domestic product in the Yukon). Large-scale extraction of mineral and hydrocarbon resources is a significant component of the economy in some regions (Duhaime et al., 2004). Although only a fraction of the revenue from these resources remains in the regions where the activities are conducted, it nonetheless represents significant benefits in terms of wage-earning employment, significantly increasing average personal incomes. As a result, there are strong disparities in social and economic status between and within regions of the North (Table 6).
| Indicator | Canada | Yukon | Northwest Territories | Nunavut |
|---|---|---|---|---|
| High social support1 | - | 78.0 | 74.5 | 58.1 |
| Sense of belonging to local community (very strong or somewhat strong) | 62.3 | 69.3 | 72.3 | 80.9 |
| Proportion of census families that are lone female parent families | 15.7 | 19.8 | 21.0 | 25.7 |
| Personal average income (in dollars), 2000 | 29 769 | 31 917 | 35 012 | 26 924 |
| Government transfer income as proportion of total, 2000 | 11.6 | 8.6 | 7.3 | 12.9 |
| Percentage of long-term unemployed (labour force aged 15 and over)2 | 3.7 | 6.0 | 4.8 | 11.2 |
| Percentage of population aged 25–29 that are high school graduates | 85.3 | 85.4 | 77.5 | 64.7 |
1 Level of perceived social support reported by population aged 12 and over, based on their responses to eight questions about having someone to confide in, someone they can count on in a crisis, someone they can count on for advice, and someone with whom they can share worries and concerns.
2 Labour force aged 15 and over who did not have a job any time during the current or previous year.
Food insecurity in Canada is highest in the three territories, where there are significantly higher numbers of female single parent households (Table 6; Statistics Canada, 2001, 2005a) and the cost of a standard list of grocery items can be up to three times higher than in southern Canada (Table 7; Statistics Canada, 2005a). In communities not accessible by road (e.g. Nunavut, Nunavik and Nunatisavut and some smaller regions and communities in the Northwest Territories and Yukon), access to market food items is reliant upon shipment via air or sea, which significantly increases the price. Data from 2001 show that 68% of households in Nunavut, 49% of those in the Northwest Territories and 30% of those in the Yukon had at least one occasion in the previous year when they did not have the financial resources for sufficient food.
| Location | Perishables | NonPerishables | Total food basket |
|---|---|---|---|
| Nunavut | |||
| Iqaluit (2005) | 114 | 161 | 275 |
| Pangnirtung (Baffin) (2005) | 127 | 165 | 292 |
| Rankin Inlet (Kivalliq) | 153 | 165 | 318 |
| Kugaaruk (Kitikmeot) | 135 | 187 | 322 |
| Northwest Territories | |||
| Yellowknife | 65 | 94 | 159 |
| Deline | 148 | 161 | 309 |
| Tuktoyaktuk | 129 | 154 | 282 |
| Paulatuk | 180 | 167 | 343 |
| Yukon | |||
| Whitehorse (2005) | 64 | 99 | 163 |
| Old Crow | 169 | 219 | 388 |
| Selected southern cities | |||
| St. John's, NF (2003) | 66 | 78 | 144 |
| Montreal, QC (2005) | 64 | 90 | 155 |
| Ottawa, ON | 72 | 93 | 166 |
| Edmonton, AB | 65 | 108 | 173 |
Chapin et al. (2005) reported that, despite the physical, economic and administrative challenges to health for some residents in the North, the deterioration of cultural ties to land-based and subsistence activities among Aboriginal people is the most serious cause of decline in well-being within circumpolar regions. The loss of connection to the land through changes in ways of life, loss of language and dominance of non-Aboriginal education systems are impacting health and well-being in various and long-lasting ways.
2.3 CLIMATIC CONDITIONS, PAST AND FUTURE
2.3.1 Past Climate
The high natural climate variability of the Arctic, together with the relatively sparse observational data sets, make it difficult to distinguish with confidence a climate change signal in the trends observed in the instrumental period of record (McBean et al., 2005). As few stations have data prior to 1950, estimates of trends and variability are limited to the second half of the twentieth century. For the period 1950 to 1998, there is a west to east gradient in mean annual temperature trends, with significant warming of 1.5 °C to 2.0°C in the western Arctic and significant cooling (–1.0°C to –1.5°C) in the extreme northeast (Zhang et al., 2000). During more recent periods, all regions show warming . Trends were strongest in winter and spring. Annual and winter temperature anomalies and annual precipitation departures over four northern regions from 1948 to 2005 (Figure 3) show greatest warming in the Yukon and Mackenzie District (2.2°C and 2.0°C, respectively). In comparison, temperatures throughout Canada as a whole increased by 1.2 °C over this same period (Figure 3a; all trends are significant at the 0.05 level). Many of the extreme warm winters in these regions have occurred during the latter part of the record, including 2006. For northwestern Canada in general, the period 1950 to 1998 exhibited a trend towards fewer days with extreme low temperature and more days with extreme high temperature during winter, spring and summer (Bonsal et al., 2001b).
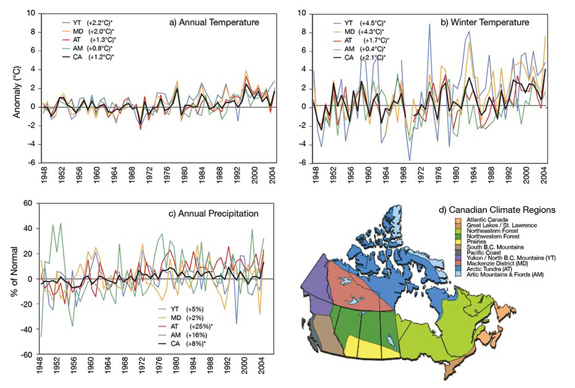
FIGURE 3: Regional temperature anomalies and precipitation departures from normal in the Canadian North: a) annual temperature; b) winter temperature; c) annual precipitation; d) Canadian climate regions. Linear trends over the period of record are given in parentheses. Asterisks signify significant trends at the 0.05 level. Data were obtained from Environment Canada's Climate Trends and Variations Bulletin.
Annual precipitation totals (1948–2005) increased throughout all of northern Canada, with the largest increases over the more northerly Arctic Tundra (+25%) and Arctic Mountain (+16%) regions (Figure 3c). The increase in high Arctic regions is evident during all seasons, with strongest trends in fall, winter and spring (see also Zhang et al., 2000). The magnitude of heavy precipitation events increased during the period of record (Mekis and Hogg, 1999), and there has been a marked decadal increase in heavy snowfall events in northern Canada (Zhang et al., 2001b).
The observed trends and variability in temperature and precipitation over northern Canada are consistent with those for the entire Arctic (McBean et al., 2005). Throughout the circumpolar Arctic (north of lat. 60 ºN), annual air temperatures during the twentieth century increased by 0.09ºC per decade. This included a general increase from 1900 to the mid-1940s, then decreases until the mid-1960s and accelerated increases thereafter. Although most pronounced in winter and spring, all seasons exhibited an increase in temperature during the past several decades. In terms of precipitation, the entire Arctic has shown a significant positive trend of 1.4% per decade for the period 1900 to 2003. Largest increases generally occurred in fall and winter. Some studies have also suggested that the fraction of annual precipitation falling as snow has diminished, which is consistent with widespread temperature increases (McBean et al., 2005).
The pre-instrumental climate history of northern Canada is known from various natural archives, including tree rings, lake and marine sediments and glacier ice, and from the mapping and dating of glacial moraines and other geomorphic features (McBean et al., 2005). The climate of the North during the last 10 000 years has been characterized by relative warmth and remarkable stability (Figure 4). In the last 2000 years, climate has been characterized by multi-centennial oscillations ranging from mild conditions (similar to the modern era) to widespread persistence of relatively cool conditions (Figure 5). The general pattern of variability is believed to reflect primarily long-term natural fluctuations in circumpolar atmospheric circulation, expressed during the Little Ice Age (ca. AD 1500 –1800) by increased southward penetration of cold Arctic air due to intensified meridional circulation (Kreutz et al., 1997).
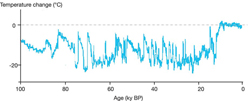
FIGURE 4: Temperature change (departure from present) during the past 100,000 years reconstructed from Greenland ice core (Ganopolski and Rahmstorf, 2001).
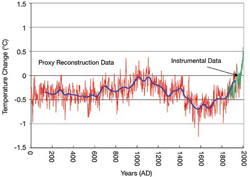
FIGURE 5: Reconstruction of northern hemisphere mean annual temperature, expressed as departures from the 20th century mean (Moberg et al., 2005).
Climate of the last 400 years has been characterized by warming and related changes over most of the Arctic, including retreat of glaciers, reduction in sea-ice extent, permafrost melting, and alteration of terrestrial and aquatic ecosystems (Overpeck et al., 1997). During the past approximately 150 years, however, it is evident that the rate and nature of change are unprecedented since the abrupt warming at the onset of the current interglacial period more than 10 000 years ago. This rapid acceleration in temperature increase over the Arctic is projected to continue throughout the twenty-first century (Kattsov et al., 2005).
2.3.2 Future Climate
Comparisons of the ability of seven Atmosphere-Ocean General Circulation Models (AOGCMs, see Chapter 2) to simulate the mean values and spatial variability of current (1961–1990) temperature and precipitation over four regions spanning Northern Canada revealed considerable inter-regional and seasonal variability, with temperature being more accurately simulated than precipitation (Bonsal and Prowse, 2006; see also Kattsov et al., 2005). The British Hadley Centre for Climate Prediction and Research (HadCM3), the German Max Planck Institut f ür Meteorologie (ECHAM4) and the Japanese Centre for Climate Research Studies (CCSRNIES) models best replicated annual and seasonal temperature values over all subregions, with the Canadian Centre for Climate Modelling and Analysis (CGCM2) and American National Centre for Atmospheric Research (NCAR-PCM) models having intermediate accuracy and the Australian Commonwealth Scientific and Industrial Research Organisation (CSIROMk2) and American Geophysical Fluid Dynamics Laboratory (GFDL-R30) models being least representative. Collectively, the AOGCM temperature simulations displayed a similar degree of accuracy over all subregions. Conversely, precipitation was only accurately simulated by the majority of models over northern Quebec and Labrador. Annual and seasonal precipitation amounts were substantially overestimated by all AOGCMs in the western and central Canadian Arctic.
Climate Change Projections for the Canadian North
Scenarios of climate change with respect to the 1961–1990 baseline for the 30-year periods centred on the 2020s (2010–2039), 2050s (2040–2069) and 2080s (2070–2099) are presented in scatterplot and map format (see Appendix 1 of Chapter 2 for descriptions).
Scatterplots for the western and eastern regions of the North, divided at longitude 102°W, reveal little difference in projections between the two regions (Figure 6). For the 2020s, both western and eastern regions exhibit mean annual temperature changes concentrated near +2.0 °C and precipitation increases ranging from 5 to 8%. Intermodel variability is greatest during the 2080s: median temperature changes for the western region are near +6.0 °C but range from +3.5°C (NCAR-PCM B2 scenario) to +12.5°C (CCSRNIES A1FI scenario); most scenarios project a 15 to 30% increase in annual precipitation. Note that projections during all periods fall outside the range of modelled natural variability indicated by the grey squares in Figure 6.
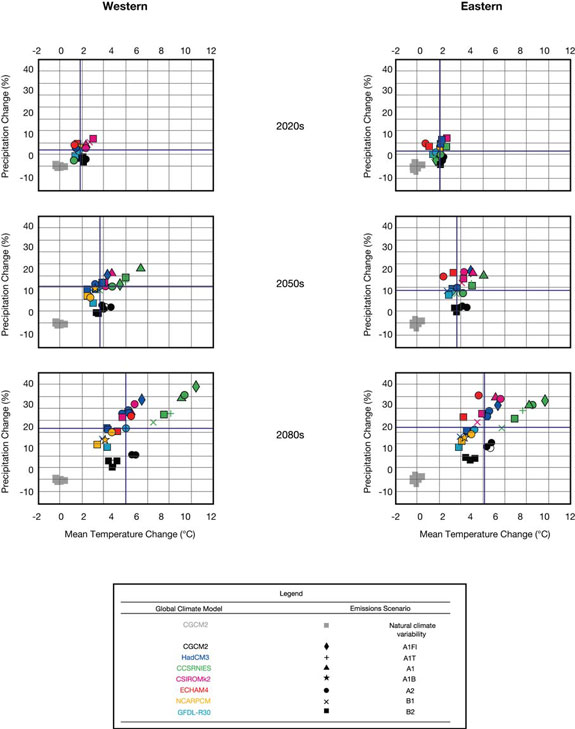
FIGURE 6: Scatterplots of projected mean annual temperature and precipitation changes in eastern (right) and western (left) regions of Northern Canada. Blue lines represent median changes in mean temperature and precipitation derived from suite of scenarios on plot (see Appendix 1 of Chapter 2 for details).
Insights into projected seasonal climate change are evident in scatterplots for the 2050s (Figure 7). Despite considerable intermodel variability, the greatest temperature changes are projected to occur during winter. The eastern Canadian Arctic exhibits slightly higher projections of winter temperature than the west. Summer has the lowest projected temperature increases and the least amount of intermodel scatter. With respect to precipitation changes, values during winter range from near 0% over both regions to more than 40% in the east, with most scenarios projecting winter precipitation increases of 20 to 30%. During summer, all models project increases between 5 and 20%, with median values of 10%.
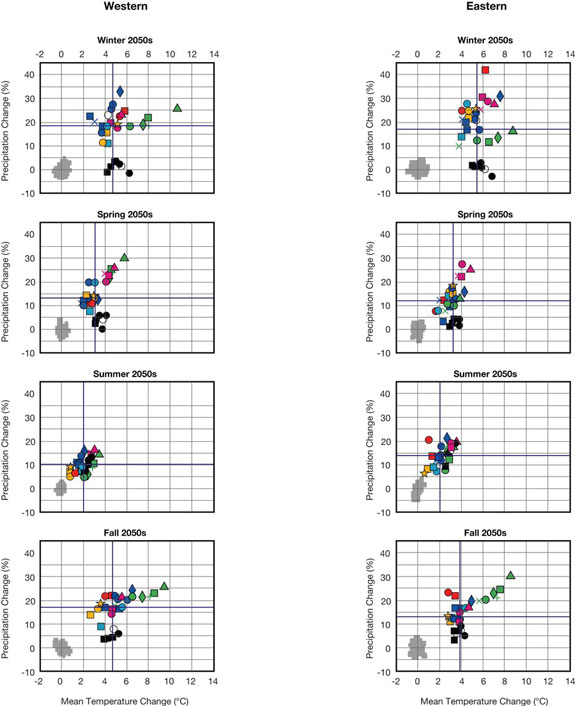
FIGURE 7: Scatterplots of projected seasonal temperature and precipitation changes for the 30 year period centred on the 2050s over eastern (right) and western (left) regions of Northern Canada. Blue lines represent median changes in mean temperature and precipitation derived from suite ofscenarios on plot (see Appendix 1 of Chapter 2 for details).
Spatial characteristics of annual and seasonal projected temperature changes over northern Canada indicate that the greatest temperature changes will occur at higher latitudes, particularly in the extreme northwest (Figures 8 and 9). Seasonally, the greatest temperature changes over the entire region are projected to occur during winter and fall. Annual and seasonal precipitation changes show considerable spatial variability in the Canadian Arctic, with the greatest annual percentage increases projected over more northerly regions (Figures 10 and 11). Seasonal maps for the 2050s show even higher variability, with minimum changes associated with decreases in precipitation over parts of the region during all seasons. The median projections tend to show greatest increases during winter and fall, particularly in more northerly regions.
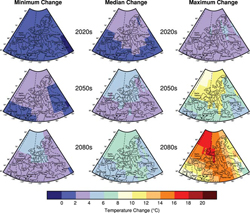
FIGURE 8:Maps of projected changes in mean annual temperature over Northern Canada.
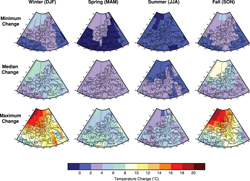
FIGURE 9: Maps of projected seasonal changes in temperatures for the 30-year period centred on the 2050s over Northern Canada.
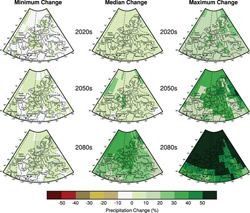
FIGURE 10: Maps of projected changes in mean annual precipitation over Northern Canada.
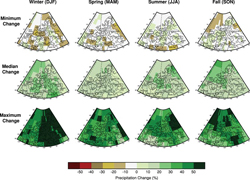
FIGURE 11: Maps of projected seasonal changes in precipitation for the 30-year period centred on the 2050s over Northern Canada.
The high degree of variability inherent in Arctic climate increases the uncertainty of projected changes in temperature and precipitation. Given the findings of Bonsal and Prowse (2006), it is recommended that a range of future climate projections be used when examining potential impacts across the North (see also Chapter 2). Individual model outliers, such as the CGCM2 low precipitation projections and the CCRSNIES high temperature increases (Figure 8), should be used with caution due to their inconsistency with other model projections.
Page details
- Date modified: