
2. Sector Profile – Canadian Plastics Processing Sector Overview
The "Sector Activities" section in this chapter focuses on the nature of Canada’s plastics processing industry. The plastics processing industry is a significant part of a larger plastics manufacturing sector. Canadian material suppliers manufacture resins from petrochemical and other feedstocks. Canada also has several world-class manufacturers of processing machinery and is a major producer of tooling for domestic and international plastics processors.
Canadian sales revenue in the plastics processing sector exceeded $38 billion in 2004. This chapter discusses some of the major economic factors that affect Canadian processors’ ability to compete in international markets. Trade balances and trends are also examined.
This chapter also discusses the use of resources and energy by the plastics processing industry and provides a context for discussing savings opportunities.
The "Process Residuals" section discusses wastes and emissions that may be generated from plastics processing. Environmental legislation relevant to the Canadian plastics processing sector is also discussed in this section.
2.1 Sector Activities
The plastics processing sector is characterized by many different processes and applications that use an ever-increasing variety of raw materials. In addition to plants devoted to producing custom products for third parties, many Canadian manufacturers have unique "captive" plastics processing operations that manufacture finished goods for sale or components for other end products. This diversity creates difficulty in assembling accurate statistics for the industry. However, it is clear that the sector represents a significant portion of Canada's industrial activity and continues to experience a growth rate well in excess of the average for all manufacturers.
In 2004, the Canadian plastics processing sector generated about $38.4 billion in shipments and employed more than 146,000 people in approximately 3,800 companies. The major markets served by the plastics industry are packaging, construction and transportation (automotive). These segments account for 34, 26 and 18 percent, respectively, of the total resin processed in Canada.
A brief and current profile of the plastic products processing sector is outlined in Table 2-1.
| Total Canadian Value Chain | $50.9 billion |
| Shipments by Processors | $38.4 billion |
|
Shipments by Raw Material, Machinery and Mould Suppliers |
$12.5 billion |
| Total Processors Employment | 146,880 |
| Total Suppliers Employment | 24,500 |
| Total Sector Employment | 171,380 |
| Number of Plants | 3,757 |
| Resin Capacity (metric tonnes) | 5.2 million |
| Plastics GDP* Growth vs. All Manufacturing | 2.7 times faster |
| All Manufacturing GDP Growth | 17% since 1999 |
| Plastics Products GDP Growth | 46.1% since 1999 |
|
* gross domestic product |
|
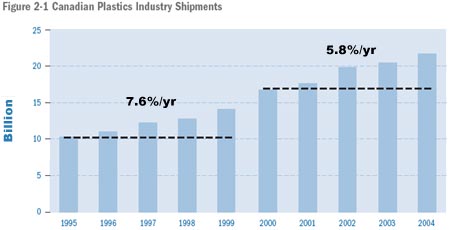
Following a brief period of decline in shipments in the early 1990s, which was due to several macro-economic factors, Canadian plastic products shipments have increased every year for the past 10 years, as shown in Figure 2-1. For the five-year period of 1995 to 1999, Canadian plastic products shipments increased by an average of 7.6 percent per year; and for the five-year period of 2000 to 2004, shipments increased by an average of 5.8 percent per year.
The plastics products industry has shown strong growth over the last decade with plastics products gross domestic product (GDP) outgrowing the overall manufacturing sector GDP growth by 2.7 times since 1999.
2.2 Industry Structure and Plant Profile
Although some consolidation and rationalization has taken place in the last few years, Canada's plastics processing industry continues to be characterized by a large number of small- and medium-sized enterprises.
The average Canadian establishment employs approximately 40 people and has annual sales of approximately $10 million. A number of Canadian plastics processors have emerged as significant players in the North American market, each employing several hundred to over a thousand people. Approximately two thirds of these larger companies are Canadian-owned. Each of these firms has sales volumes in excess of several hundred million dollars, and several have international affiliates or subsidiaries.
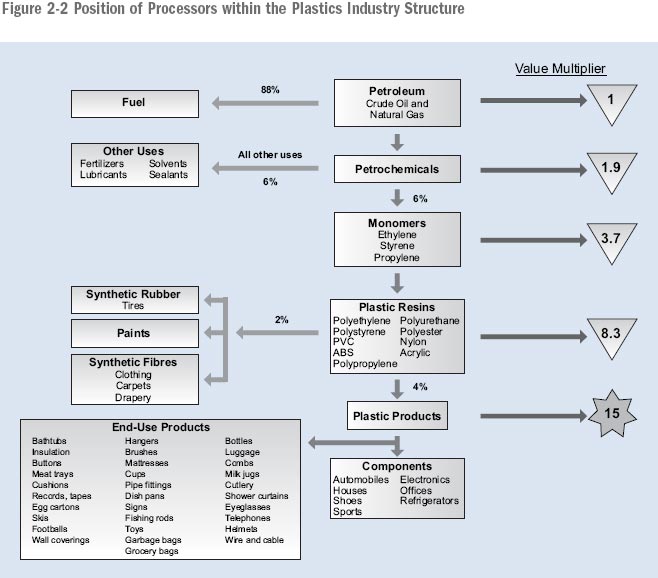
The structure of the industry showing the flow from raw materials to products is shown in Figure 2-2. The custom and proprietary processors produce products that are sold to other manufacturers or marketed directly by the producer. The captive processors incorporate the plastic products manufactured as components into other products.
2.3 Current Economic Status
Historically, many Canadian plastics manufacturers have been at a disadvantage to U.S. producers with larger and more concentrated local markets. The smaller production runs led to higher unit costs. For some bulky products, such as plastic piping, blown bottles or beverage crates, high shipping costs have forced producers to set up operations to serve regional markets. Most of Canada's plastics processors are located close to their customers in areas of high population density.
As a result of tariff reductions under the Free Trade Agreement (FTA) and North American Free Trade Agreement (NAFTA), there has been some rationalization of end-use industries. Certain traditional customers for plastics products have moved out of Canada to the U.S. and Mexico as a result of the consolidation of production in a U.S.–owned firm or the availability of lower Mexican assembly costs for labour-intensive products. NAFTA had a modest incremental impact that resulted in some customers looking outside of Canada for auto-related components and for lower value-added products. These losses have been offset by, among other factors, the general strength of the Canadian automotive assembly sector and the trend to just-in-time procurement that encourages parts manufacturers to locate near assembly plants.
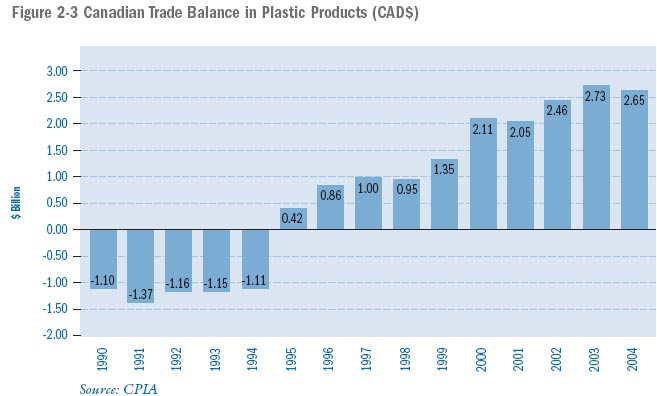
According to Industry Canada data on the plastics industry, the trade balance for Canadian plastics products, which was a deficit for the first half of the 1990s and became a surplus in 1995, has grown to $2.65 billion by the year 2004, as shown in Figure 2-3.
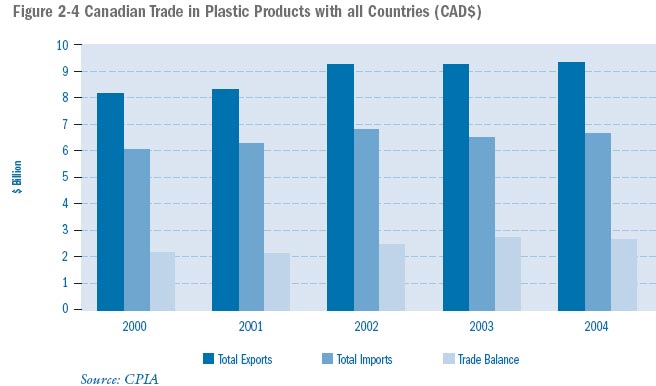
Export sales have risen in recent years (Figure 2-4) as the trade surplus increased by 20 percent since 2000.
Trade with the U.S., which represents more than 90 percent of Canadian plastic products exports, increased by approximately 15 percent over the past five years, while imports from the U.S. have remained relatively constant with only a 1 percent increase (see Figure 2-5). This trend has resulted in a trade surplus growth of 43 percent for the period between 2000 and 2004.
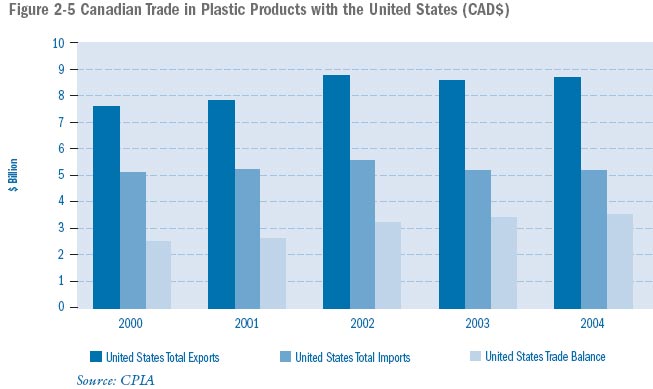
Industry observers contend that Canadian plastic processors are well-positioned to grow and compete on an international level in the coming years. The trade data show growth in trade surplus with all countries, but when the trade surplus with the U.S. is removed, Canada is in a trade deficit situation.
2.4 Resource Usage
The significant categories of resource usage by the plastics processing sector are discussed below. The use of raw materials, usually the single-largest cost factor in a plastics processing operation, is often difficult to track and manage effectively. Overall energy, water and solid waste disposal costs are readily identified in utility and waste management bills. However, many plants have little detailed knowledge of associated unit costs by specific machines or processes.
2.4.1 Materials
2.4.1.1 Resins
For most manufacturers in this sector, raw materials are the single-largest operating cost. In some operations with high throughputs, such as profile extrusion, it is not uncommon for material purchases to exceed 70 percent of manufacturing expense. Typically, direct labour constitutes 5 to 15 percent of the expense, while total energy costs are often less than 5 percent.
Raw materials include resins, UV stabilizers, pigments, lubricants and other processing aids and additives. This guide focuses primarily on firms that receive thermoplastic resins in pellet form and does not specifically address operations that compound raw materials. Pellets are routinely shipped in containers ranging from 25-kg bags to 500-kg gaylords, to even larger truck or rail car shipments for high-volume producers. Improvements in the handling, processing and recycling of raw materials represent a significant savings opportunity in this sector.
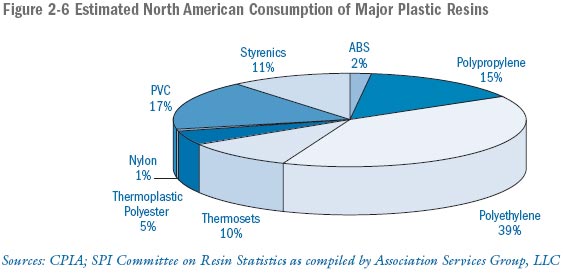
Numerous types of resins are used. Material suppliers constantly increase the range of options available by developing new materials targeted at specific applications. The estimated consumption of resins (by major type) in North America is provided in Figure 2-6.
2.4.1.2 Other Supplies
Plastics processing facilities use a wide range of plant supplies related to equipment and plant maintenance. Other supply categories related to specific processes and secondary operations are also used.
Typical supply categories include the following:
- Hydraulic oil: used to power process machinery. While the oil does not typically need to be replaced frequently, losses through leaks and hose breakages may occur.
- Tool room supplies: cutting oils, solvents and greases.
- Processing supplies: some processors add pigments or dyes, and some moulding operations also use mould releases.
- Plant cleaning supplies: plant cleaning supplies include soaps, detergents and absorbent materials for cleaning up oil spills.
- Packaging and distribution materials: bags, gaylords and pallets. Shipments of finished goods may be made in any or all of the following forms: cartons, plastic bags and/or wooden crates.
2.4.2 Energy
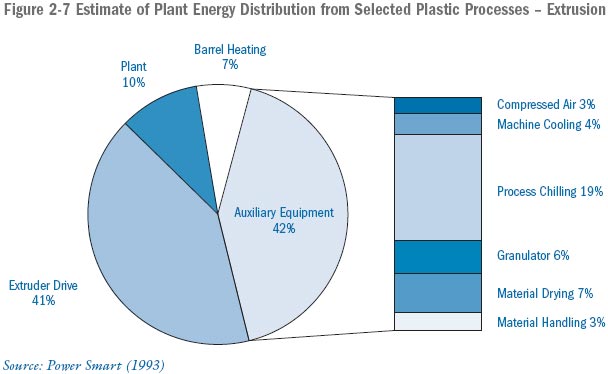
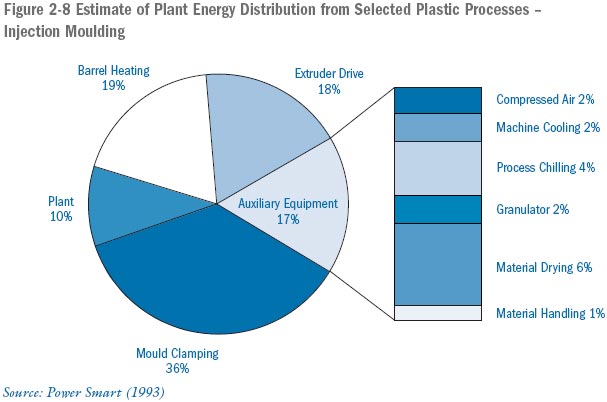
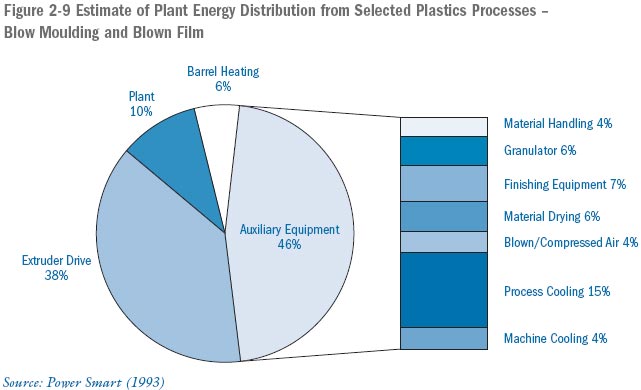
Detailed estimates of the distribution of energy demand for typical extrusion, injection moulding, blow moulding and blown-film plants were developed in 1993 for the former Energy Mines and Resources Canada (now Natural Resources Canada) by Power Smart Inc. of Vancouver. These data are summarized in Figures 2-7 to 2-9 for four generic processes: 1) extrusion, 2) injection moulding, 3) blow moulding and 4) blown film.
The estimates illustrate the relative importance of energy demand by the processes and auxiliary equipment as a proportion of the total facility demand. Furthermore, details of the total process demand are provided to assist manufacturers in identifying priority areas for energy-reduction projects.
2.4.2.1 Electricity
Electricity is the main source of energy used by plastics processors. The main uses of electricity include such applications as providing heat to extruder barrels through resistance heaters and energizing extruder drives. Electricity is also used indirectly by providing the power source for hydraulic, chilling, thermal-oil heating and compressed-air systems. Air conditioning, ventilation and lighting for the facilities are still more uses of electricity. Electrical costs account for approximately 3 to 4 percent of the production cost.
2.4.2.2 Natural Gas
Natural gas is used primarily for heating water and facilities. Other applications that can use natural gas include rotational moulding, pellet dryers and internal combustion engines, which can in turn power air compressors, hydraulic systems or electrical generators. Natural gas costs account for approximately 1 to 2 percent of the production cost.
2.4.3 WATER
Water is used for a variety of applications such as a cooling medium for profile extrusions and process-machinery components such as moulds and extruder barrels. Water is also used for cooling auxiliary equipment such as hydraulic and compressed-air systems. Water use varies widely by plant and by process.
Some smaller processors use line water in a once-through application, discharging to sanitary and/or storm sewers. Larger processors sometimes require significant volumes of cooling water and also need to control water temperature. In such cases, closed-loop water-cooling systems are preferred. Water can be recirculated and cooled using portable or permanent chillers or cooling towers.
Most plastics processors recognize that it is cost-effective to install recycling systems for process-cooling water. In addition to conserving the resource and saving money, the ability to control water temperatures allows processors to improve product quality and throughput efficiency. Environment Canada estimated in 1991 that 87 percent of water used by the plastics processing sector was being recycled. Discussions with industry leaders indicate that this number has probably increased since 1991, although no specific reference or number was available.
2.5 PROCESS RESIDUALS
Plastic processors generate various types of wastes and releases to the environment that in many cases can be reduced. Plastic materials, when processed under conditions specified by the manufacturers, are relatively stable and do not present a significant risk to humans or the environment. Cost savings may be achieved, however, by reducing waste and emissions, especially by improving the management of raw material losses due to inefficiencies.
2.5.1 AIR RESIDUALS (GASES AND DUST)
Air emissions from plastics processing include volatile organic compounds (VOCs), dust and carbon dioxide (a greenhouse gas). The following sections provide a brief description of VOCs and dust emissions from plastics processing. Greenhouse gas emissions are covered separately in Chapter 3.
2.5.1.1 Volatile Organic Compound (VOC) Emissions
VOCs are emitted from some plastics-manufacturing processes. VOCs contribute to the generation of ground-level ozone – a major component of smog.
The major source of VOC emissions in plastics processing results from the following:
- degradation of resin;
- blowing agents used for expanded foam products;
- additives;
- cleaning solvents; and
- mould-releasing agents.
The four generic processes that account for approximately 60 percent of the VOC emissions in the plastics processing sector are the following: 1) reinforced plastic and composite products made from thermoset polyester resins, 2) extruded polyethylene [PE] foam, 3) expanded polystyrene [EPS] foam and 4) polyvinyl chloride [PVC].
A Plastics Processing Working Group was formed in 1997 in response to the Ontario's Smog Plan issued by the Ontario Ministry of Environment. The group's purpose was to address VOC emissions in the four processes identified above.
VOC emission estimates for each of the processes are presented in Table 2-2.
|
Resin Consumption (tonnes processed per year) |
VOC Emission Estimates (tonnes VOC/year) |
|||||
|---|---|---|---|---|---|---|
| Process | 1990 | 1997 |
% change from 1990 |
1990 | 1997 |
% change from 1990 |
| Composites | 15,085 | 14,860 | -1.5% | 1,347 | 1,143 | -15% |
| PE Foam | 2,600 | 3,700 | +42% | 149 | 355 | +138% |
| EPS Foam | 16,740 | 12,244 | -27% | 1,023 | 711 | -30% |
| PVC | TBD | TBD | TBD | TBD | ||
| TOTAL | 34,425 | 30,804 | -10.5% | 2,519 | 2,209 | -12.3% |
The following are highlights of the VOC emission reductions achieved between 1990 and 1997 for each process sub-group.
Composites: VOC emissions were reduced by an estimated 15 percent in 1997 from 1990, while resin consumption remained essentially the same during the period. This reduction was achieved due to two main factors: First, a significant switch in process technology from open moulding to closed moulding took place (as a proportion of resin consumption, the use of open moulding declined from 80 percent in 1990 to 70 percent in 1997). With the move to closed moulding, VOC emissions have been reduced because of the lower losses of styrene associated with closed-moulding operations. VOC emission factors are estimated to be 5 percent for closed moulding as opposed to 22 percent for open moulding based on the weight of available styrene. The second factor for the achieved reduction in VOCs was due to a decrease in styrene content of supplied resin, from 48 percent in 1990 to 45 percent in 1997.
PE Foam: VOC emissions in 1997 were more than double those in 1990. The main reason is that the percentage of blowing agent used in blowing increased from 5.7 to 9.6 percent of foam produced. This was due to the switch from CFCs and HCFCs to butane as a blowing agent. As well, the increase in production rates of 42 percent also contributed to the increased emissions.
EPSFoam: VOC emissions were reduced by an estimated 30 percent in 1997 from 1990. The 30 percent decrease in emissions was largely due to a decline in Ontario resin consumption. This decline was the result of the loss of plants from Ontario. Another factor was a decline in the VOC content of the supplied resin from 6.11 to 5.81 percent by weight.
PVC: Actual reductions achieved from 1990 have not been estimated.
For more detailed information on VOC emission reduction work in the Ontario plastics processing industry, please refer to the Ontario's Smog Plan – Progress Report of the Ontario Plastic Processors Working Group (November 1999).
2.5.1.2 Dust
Some plastics processing operations are also known to emit airborne dust particles. Material handling, blending and grinding operations have the potential to generate dust. High levels of dust may create an explosion hazard. Efforts to minimize dust are also encouraged to further reduce employees' exposure to respiratory risk associated with exposure to airborne particles.
2.5.2 Wastewater and Liquid Wastes
Non-contact cooling water may be used for machinery-, mould- or auxiliary-equipment cooling prior to sanitary sewer system discharge. Potential contaminants include particulates such as pellets, hydraulic or lubricating oils, and solvents.
Liquid wastes that require special handling and are commonly generated by the plastics processing industry include used hydraulic oils, spent solvents and other chemicals.
2.5.3 Solid Waste
The solid waste stream from plastics processing operations typically includes packaging materials such as bags, gaylords and skids, purgings from machine start-ups, degraded material and unsalvageable scrap. Pellets that have been spilled and raw materials that have been contaminated by mixing or by foreign matter may also become solid waste destined for disposal.
Other wastes not specifically related to the process include office waste, waste paper, corrugated packaging, cafeteria/lunch room food wastes, bottles and cans, and landscaping wastes.
2.5.4 NOISE
Hydraulic pumps, scrap grinders, sonic welders, and material handling and conveying equipment are all considered to be common sources of objectionable noise. Excessive noise levels can result in unpleasant working conditions. It may be necessary to control noise levels to prevent exceeding the limits set out by the Occupational Health and Safety Regulations.
Plant noise that affects neighbouring residential, commercial or industrial operations is regulated by municipal noise control by-laws. Noise sources that may exceed limits and give rise to neighbourhood complaints can include material-handling techniques, such as the emptying of tank trucks or rail cars.
2.6 Environmental Legislation
Many responsible processors seek to achieve environmental performance that would exceed compliance with environmental legislation. A variety of environmental legislation is of interest and could pertain directly to the plastics processing sector. The legislation is intended to protect the environment from all potential discharges to the air, water and land. Specific regulations vary by province/territory, but the key areas of relevant legislation for plastic processors include the following:
- air emissions – particulates, odours, ozone-depleting substances and greenhouse gases;
- effluent discharges – direct discharges to receiving bodies and discharge to sewers;
- solid wastes – hazardous and industrial wastes; and
- recycling.
Page details
- Date modified: