
INTEGRATION Software
Industrial processes release large amounts of energy into the atmosphere, part of which can be recovered for reuse, thus generating significant energy savings. Potential heat recovery possibilities can be found in service-producing utility systems and also at the process level. Maximizing the amount of heat recovered requires an integrated approach which includes both the utilities and the process itself. For such purposes, CanmetENERGY promotes the use of process integration.
INTEGRATION Software: A Unique Tool for Identifying and Assessing Energy Saving Projects
CanmetENERGY developed the INTEGRATION software in order to better respond to the need for practical and low-cost process integration computation tools. With this software, energy efficiency experts are able to identify and evaluate energy saving projects in a global analysis framework. More specifically, the INTEGRATION software can:
- Determine the energy performance of industrial energy systems
- Identify and quantify actual waste heat levels as well as areas where heat exchange is inadequate
- Quickly analyze changes in the operating conditions of energy-intensive equipment such as boilers, compressors, kilns, dryers, etc.
- Define and evaluate heat recovery projects at the level of energy-intensive equipment and heat exchanger networks
Coupled with training activities and technical support for its users, the INTEGRATION software is an important component of the Process Integration Skills Development Program, managed by CanmetENERGY and its partners. Software development is supported by the Office of Energy Efficiency (Natural Resources Canada) and the Bureau de l’efficacité et de l’innovation énergétiques.
The INTEGRATION software as well as technical support for its users are only available to Canadian engineers having attended the energy integration of industrial processes training course. Therefore, if you wish to obtain the software, you must first register and attend the training course.
INTEGRATION Software Features
The INTEGRATION software consists of several computation modules based on sophisticated analysis models and tools built around a user-friendly interface. It also includes a comprehensive user guide.
Boiler module – for steam production and thermal fluid systems
CanmetENERGY developed the INTEGRATION software in order to better respond to the need for practical and low-cost process integration computation tools. With this software, energy efficiency experts are able to identify and evaluate energy saving projects in a global analysis framework.
The INTEGRATION software consists of several computation modules based on sophisticated analysis models and tools built around a user-friendly interface.
The Boiler module allows carrying out energy analyses of industrial steam production and thermal fluid systems, and more precisely:
- Calculating various operating parameters as well as the energy efficiency of industrial boilers
- Identifying and determining the quantity and quality of waste heat emitted by such equipment
- Evaluating various heat recovery projects (domestic water preheater, condensing economizer, blowdown heat recovery, heat recovery from condensate flash steam) for heating boiler feedwater or any other stream needing to be heated
- Evaluating various projects involving changes in operating conditions
Refrigeration module – for industrial refrigeration systems
CanmetENERGY developed the INTEGRATION software in order to better respond to the need for practical and low-cost process integration computation tools. With this software, energy efficiency experts are able to identify and evaluate energy saving projects in a global analysis framework.
The INTEGRATION software consists of several computation modules based on sophisticated analysis models and tools built around a user-friendly interface.
The Refrigeration module allows carrying out energy analyses of industrial refrigeration systems, and more precisely:
- Calculating various operating parameters as well as the energy performance of several refrigerants and different types of refrigeration compressors
- Identifying and determining the quantity and quality of waste heat emitted by such equipment
- Evaluating various heat recovery projects (desuperheater, oil cooler, condenser, sub-cooler, suppressor) for preheating a stream needing to be heated
- Evaluating various projects involving changes in operating conditions
Compressed air module – for process air and gas compressors
CanmetENERGY developed the INTEGRATION software in order to better respond to the need for practical and low-cost process integration computation tools. With this software, energy efficiency experts are able to identify and evaluate energy saving projects in a global analysis framework.
The INTEGRATION software consists of several computation modules based on sophisticated analysis models and tools built around a user-friendly interface.
The Compressed Air module allows carrying out energy analyses of industrial compressed air systems, and more precisely:
- Calculating various operating parameters as well as the energy performance of different types of process air or gas compressors
- Identifying and determining the quantity and quality of waste heat emitted by such equipment
- Evaluating heat recovery projects
- Evaluating various projects involving changes in operating conditions
Pinch analysis module
CanmetENERGY developed the INTEGRATION software in order to better respond to the need for practical and low-cost process integration computation tools. With this software, energy efficiency experts are able to identify and evaluate energy saving projects in a global analysis framework.
The INTEGRATION software consists of several computation modules based on sophisticated analysis models and tools built around a user-friendly interface.
The Pinch Analysis module allows:
- Carrying out a Pinch analysis of the heat exchangers in a given process, with the option of including – or not including – waste heat from utility production systems
- Determining the potential for energy savings (during heating and cooling) and identifying the heat exchangers that are sources of inefficient energy use
- Defining the changes needing to be made to a given set of heat exchangers in order to improve energy recovery
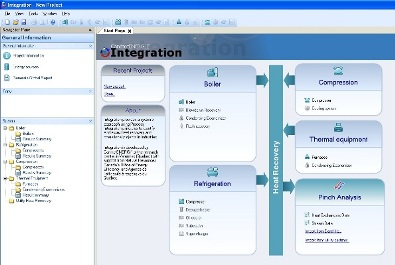
Screenshot of the INTEGRATION Software
Text Version
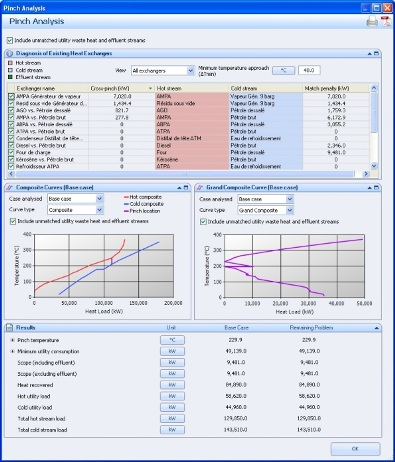
Screenshot: Pinch Analysis
This image is a screenshot of the Integration software’s Pinch Analysis module. In the first window at the top of the screen, information relating to the Diagnosis of Existing Heat Exchangers is shown.
The information is presented in a table separated into five columns: the first column lists the exchanger name; the second column indicates the cross-pinch value in kilowatts; the third column lists the hot streams; the fourth column lists the cold streams; and the fifth column shows the match penalty values in kilowatts.
Under this window, there are two smaller windows seen side by side. The window on the left shows a composite curve diagram in the form of a graph. On the graph, temperature values ranging from 0 to 400 degrees Celsius make up the vertical axis while heat load values ranging from 0 to 200,000 kilowatts make up the horizontal axis. A hot composite curve is shown in red on the graph and a cold composite curve is shown in blue. The pinch location is also shown in purple.
The window on the right shows a grand composite curve diagram in the form of a graph. On the graph, temperature values ranging from 0 to 400 degrees Celsius make up the vertical axis while heat load values ranging from 0 to 50,000 kilowatts make up the horizontal axis. The grand composite curve is indicated in purple on the graph.
Below these graphs, a final window in the form of a table presents the analysis results. The table is divided into four columns: the first column indicates the different result components such as the Pinch temperature, minimum utility consumption, scope, heat recovered, etc.; the second column indicates the unit of measurement for the component values, either in kilowatts or in degrees Celsius; the third column shows the component values for the Base Case; and the fourth column shows the values of the Remaining Problem.
Screenshot of the INTEGRATION Software's Pinch Analysis Module.
Text Version
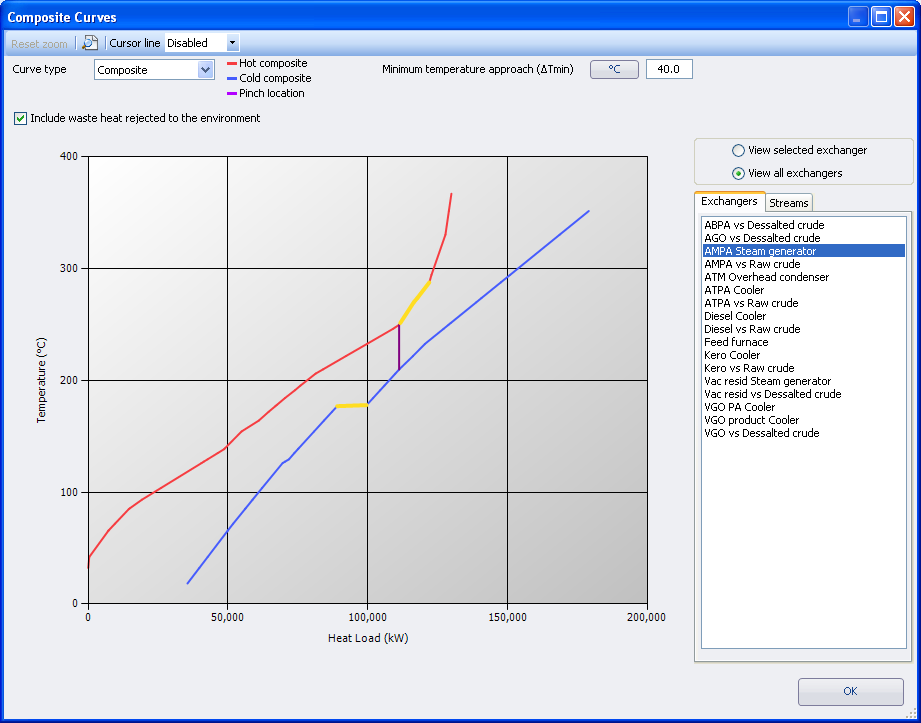
Screenshot: Composite Curves
This image is a screenshot of a composite curve taken from the Integration software. In this screenshot, a window shows a composite curve diagram in the form of a graph.
On the graph, temperature values ranging from 0 to 400 degrees Celsius make up the vertical axis while heat load values ranging from 0 to 200,000 kilowatts make up the horizontal axis. A hot composite curve is shown in red on the graph and a cold composite curve is shown in blue. The pinch location is also shown in purple.
The minimum temperature approach is indicated at the top of the window and a menu on the right side of the graph gives the option of seeing the system’s different exchangers and streams.
Screenshot of a composite curve taken from the INTEGRATION Software.
Page details
- Date modified: