
Geomatics information for the watershed serving Iqaluit, Nunavut, using EO data and ground surveys
PDF Version [PDF, 830 KB]
Paul Budkewitsch, C. Prévost, G. Pavlic, Canada Centre for Remote Sensing, Natural Resources Canada
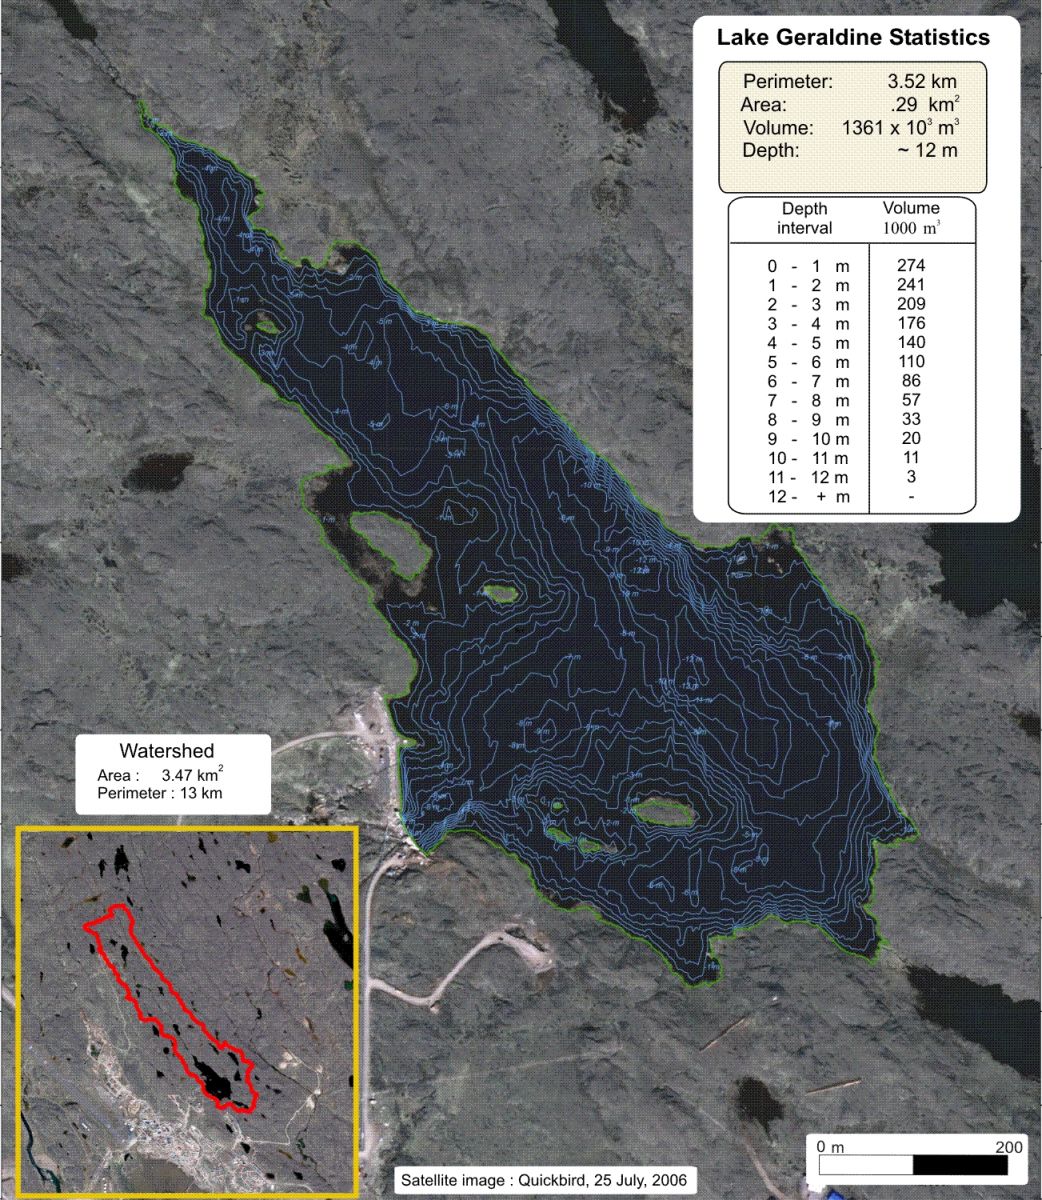
Figure 1: Bathymetric contour lines (isobaths) were generated at 1 metre intervals and total lake volume, and water volume at various depth intervals.
Text Version
Figure 1
This image map covers Lake Geraldine, the lake supply of drinking water in the town of Iqaluit, Nunavut. The product aims to demonstrate the potential of GIS to generate a bathymetric map with a satellite image as the background. The lake covers an area of 0.29 square kilometers and has a maximum depth of approximately 12 meters. The authors have produced volume of water values for every meter of depth, with a total water volume of 1,362,000 cubic meters. The Geraldine Lake drains a watershed of 3.47 square kilometers. The watershed has a perimeter of 13 kilometers.
Northern Canadian communities, like other communities in Canada, face numerous challenges in order to ensure access to safe and plentiful water supplies. There are several factors that make this responsibility different in the North such as reliance on surface water only, presence of permafrost, low precipitation, rising consumption and changes in climate, placing an additional strain on the limited resource of surface freshwater. This research presents an example of bathymetric survey and watershed boundary mapping for the protection and evaluation of freshwater supplies for the city of Iqaluit in Nunavut. The technology transfer aspect of the activity was orientated towards local personnel on how low-cost equipment can be used to provide basic, yet accurate information.
In July 2007, on site field surveys were conducted by scientists from Natural Resources Canada, a Nunavut government technologist and a local college teacher, to apply watershed mapping methods to support the monitoring of Lake Geraldine, the water supply reservoir of the city of Iqaluit, and for community planning.
Several geomatics information datasets resulted from this initiative.
- The outline of the watershed of Lake Geraldine was carefully mapped, using various techniques. The result is illustrated (inset) in Figure 1.
- This initiative also included a detailed bathymetric survey of the lake itself. Bathymetric contour lines (isobaths) were generated at 1 metre intervals and a map at a scale of 1: 2,000 was produced as shown in Figure 1. Derived information is included on the map, such as total lake volume, and water volume at various depth intervals (A limited number of copies are available upon request).
- In addition to the watershed and bathymetric surveys, precise ground control points were acquired to georeference a high resolution (QuickBirdTM) satellite image. This corrected, geocoded image is used as a geographic reference for several development applications and has been distributed to registered partners.
- Several sources of ground control points were used to rectify the image, including high precision GPS and existing Geodetic Survey points characterized as painted crosses on the ground. These points will also be used for the orthorectification of a newly acquired high resolution (WorldView-1TM) stereo image dataset for the production of a detailed digital elevation model of the Iqaluit surroundings.
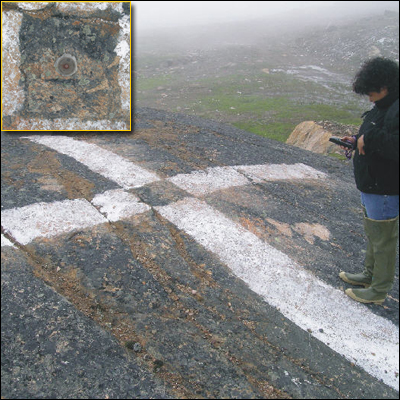
Figure 2: Several sources of ground control points were used to rectify the image, including high precision GPS and existing Geodetic Survey points characterized as painted crosses on the ground. These points will also be used for the orthorectification of a newly acquired high resolution stereo image dataset for the production of a detailed digital elevation model of the Iqaluit surroundings.
Text Version
Figure 2
This picture, taken of bare ground near Iqaluit, shows a person holding a GPS standing in front of a white cross painted on the ground. The top left insert shows the center of the cross where we find a geodetic monument. The cross serves as a benchmark for surveying purposes.
Within the scope of the project Building Resilience to Climate Change in Human Settlements, this technology transfer activity in geomatics and remote sensing led to the production of a detailed map and statistics related to the surface freshwater resource, and the training of local personnel. All team members recognised how effectively this initiative can be reproduced in other communities of Nunavut. Improved estimates of water reservoir volume and watershed boundaries provides important information which assists with monitoring a changing climate that is beginning to affect the Arctic more significantly.
Page details
- Date modified: