
Canadian Mineral Production
Canadian Mineral Production Information Bulletin
(published in July 2022)
Canada’s mining industry is the leading global producer of potash and is ranked among the top five producers of aluminum, cobalt, diamonds, fluorspar, gemstones, gold, indium, niobium, palladium, platinum, tellurium, titanium concentrate and uranium.
The 60 minerals and metals produced by Canada’s mining industry constitute key raw materials for goods that we rely on in our daily lives and for advanced technologies that will enable the transition to a low-carbon economy: from fertilizers and construction materials to smartphones, electric cars and solar cells.
Find out about the latest trends in Canada’s mineral production:
- Overview
- Metals
- Battery minerals
- Non-metals
- Coal
- Mineral production by province and territory
- Interpreting variations
Overview
The value of Canada’s mineral production surged 20% year-over-year (YoY), reaching a record high of $55.5 billion in 2021. The previous peak of $50.9 billion was reached in 2011.
The rise was principally due to price increases for most minerals and metals as key economies started to reopen and demand recovered, while supply chains and some important producing countries continued to struggle with the impacts of the COVID-19 pandemic. In 2021, prices for primary ferrous and non-ferrous metal products rose 43.1% and 21.6% YoY, respectively.
Figure 1: Metals and minerals production value and price index, 2001–2021 (p)
.png)
Figure 1 — Text version
This chart shows the value of mineral production (in current dollars) for the years 2001 to 2021. A line graph depicting the Bank of Canada’s minerals and metals price index is superimposed over the bar graph. The combined chart shows the strong correlation between the metals and minerals prices and the value of mineral production, with upward movements in the price index corresponding to rising values.
Sources: Natural Resources Canada, Statistics Canada, Bank of Canada.
p = preliminary.
Canada’s top five mineral products by value in 2021 were gold ($13.7 billion), coal ($8.0 billion), iron ore concentrates ($6.5 billion), potash ($4.8 billion) and copper ($4.5 billion). Their combined value of $37.5 billion accounted for about two-thirds of the total value of mineral production.
The value of production of all major metallic and non-metallic minerals increased in 2021, with the exception of nickel and stone, whose values of production decreased by 3% and 1%, respectively.
Figure 2: Top 5 mineral products, 2020 and 2021 (p)
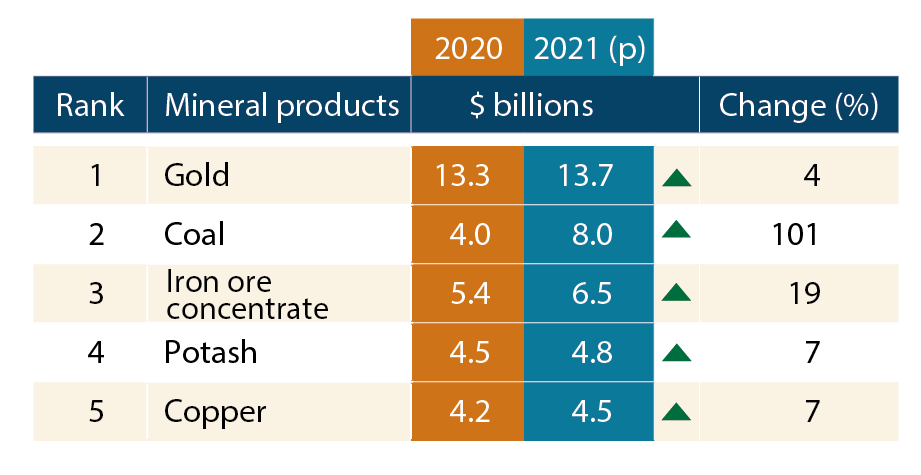
Figure 2 — Text version
This graphic shows Canada’s top five mineral products by value for 2020 and 2021. Gold was $13.3 billion in 2020 and increased to $13.7 billion in 2021. Coal was $4.0 billion in 2020 and increased to $8.0 billion in 2021. Iron ore concentrates was $5.4 billion in 2020 and increased to $6.5 billion in 2021. Potash was $4.5 billion in 2020 and increased to $4.8 billion in 2021. Copper was $4.2 billion in 2020 and increased to $4.5 billion in 2021.
Sources: Natural Resources Canada, Statistics Canada.
p = preliminary.
Metals
In 2021, the volume of slightly more than half of the metals shipped by Canadian mines decreased; however, the value of production increased by 13% to $35.7 billion due to higher prices. See Table 1 below for the production volumes and values of Canada’s principal mined commodities for 2020 and 2021.
The value of gold production increased by only 4% despite a more substantial increase of 25% in the quantity shipped by mines. The contrast between these increases is due to record high gold prices that were reached in 2020 and subsided the following year, but remained at historically high levels. Gold is sought as a safe-haven commodity during volatile economic times such as those recently brought on by the COVID-19 pandemic. Gold remained Canada’s top-ranked commodity by value of production in 2021, accounting for a quarter of the total value of all minerals and metals.
In 2021, the volume of iron ore concentrates shipped from Canadian mines declined by 7%, while its value increased by 19% as iron ore prices experienced substantial volatility during the year. They climbed to a historic peak of over US$200 per tonne in May and subsequently fell below US$100 a tonne by November as the markets struggled to recover.
Canadian mines shipped 521,000 tonnes of copper in 2021, representing a 9% decrease from the previous year. In contrast, the value of copper production increased by 7% to $4.5 billion. Copper prices reached an all-time high of US$11,300 per tonne in October 2021, registering a 110% growth since the start of the pandemic in March 2020.
Zinc production in 2021 increased by 25% over the previous year to 310,000 tonnes. The increase in production came primarily from the Caribou mine in New Brunswick, which resumed operations at the beginning of the year after several months of shutdown.
Battery minerals
Cobalt, graphite, lithium and nickel are the four main minerals and metals used to make electric vehicle (EV) batteries and advanced energy storage technologies.
Cobalt is mainly produced as a by-product of nickel mining in Canada, and in 2021, Canadian mines shipped 4,361 tonnes of cobalt valued at $198 million. Shipment volumes were down 9% compared to the previous year, while the value increased by 6%. Cobalt prices peaked in March 2018 at US$95,000 per tonne, but steadily declined to below US$28,500 per tonne in mid-2020 as a result of oversupply. Prices bounced back to above US$50,000 per tonne in 2021 as markets anticipate an increase in demand due to the clean energy transition.
Approximately 7,700 tonnes of graphite were shipped to markets from mines in Quebec in 2021, which is almost the same amount that was shipped in 2020.
Canada is host to several advanced lithium projects and production occurred most recently at the North American Lithium (NAL) mine in Quebec. The mine operated for a brief period in 2018 and closed in early 2019 due to low prices. In late 2020, a new owner acquired the NAL mine with the hopes of restarting mining activities. Lithium prices have been rising ahead of an anticipated surge in demand for EV batteries.
Canadian-mined nickel production in 2021 fell by 16% from the previous year to 134,000 tonnes. The decrease in production was primarily due to a strike at Vale’s Sudbury operations, which lasted 70 days. However, higher prices in 2021 helped to sustain the value of production, which fell by only 3%.
Nickel is produced in mines located in Newfoundland and Labrador, Quebec, Ontario and Manitoba, while refineries operate in Fort Saskatchewan, Alberta; Sudbury, Ontario and Long Harbour, Newfoundland and Labrador.
The clean energy transition is anticipated to sustain an increasing demand for battery minerals over multiple decades.
Non-metals
The value of non-metallic mineral production reached $11.9 billion in 2021, a 10% increase compared to 2020.
In 2021, Canadian mine production of potash remained almost identical to the previous year at 22.5 million tonnes, while the value of production increased by 7% to $4.8 billion and accounted for 40% of the total value of all non-metallic products. Canada is the largest global producer of potash, accounting for 31% of global production in 2021.
Canadian mines shipped 17.5 million carats of diamonds in 2021, 26% more than the previous year. The value of production also experienced a positive trend, increasing by 27% YoY to $1.7 billion. The activities at the Ekati diamond mine in the Northwest Territories were suspended for most of 2020 and the mine was sold to a new owner in early 2021. Since Arctic Canadian Diamond finalized the purchase of Ekati mine in February 2021, diamond production has substantially recovered. The new owner hopes to extend the life of the mine by implementing new underwater remote mining technology.
Sand and gravel was the third largest non-metal commodity by value and the most important by volume in 2021. Shipments of sand and gravel declined by 4% in 2021, while production value increased by 6% to $2.0 billion.
Coal
In 2021, Canadian mines produced 42 million tonnes of coal, a slight increase of 2% compared to the previous year. However, the value of coal production doubled to $8.0 billion as a result of surging metallurgical coal prices. Canada produces both thermal (e.g., electricity generation) and metallurgical (e.g., coking or steelmaking coal) coal, with the latter estimated to account for over 60% of the quantity produced in 2021. In 2018, the Government of Canada announced regulations to phase-out traditional coal-fired electricity by 2030.
Mineral production by province and territory
In 2021, Quebec ceded its place as the largest mining producer by value of production in Canada to British Columbia. The value of mineral production in British Columbia in 2021 was estimated at $12.9 billion, a significant increase of 59% over the previous year, followed by Quebec with $11.9 billion (+17%) and Ontario with $11.1 billion (-1%). Together, these three provinces accounted for 65% of Canada’s total mineral production value in 2021.
The increase in value of production in British Columbia was primarily due to a significant rise of the value of coal production. Coal and copper ore were the top commodities mined by value in British Columbia, accounting for 60% and 21% of the total, respectively.
In Quebec, iron ore (concentrates and agglomerates) production accounted for almost half (46%) of the total value and the value of gold production represents almost a third (29%) of the total value.
Figure 3: Value of mineral production by province and territory, 2020 and 2021 (p)
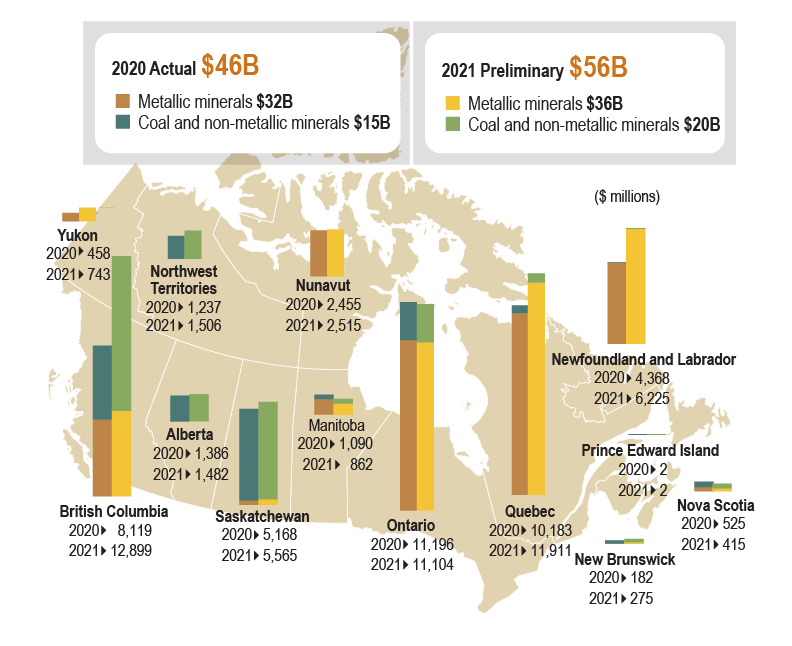
Figure 3 — Text version
This map of Canada has superimposed bar charts (two bars for the years 2020 and 2021) showing the amount of mineral production (in current dollars) for each province and territory. The top mineral producers by value in 2021 were British Columbia ($12.9 billion), Quebec ($11.9 billion) and Ontario ($11.1 billion).
Sources: Natural Resources Canada, Statistics Canada.
B = billion, p = preliminary.
Interpreting variations
The value of mineral production depends on market prices and the volume of material shipped from mines. The volume of shipments most often will vary because of shifts in ore grade; changes to mine production capacity; and mine expansions, openings, closings and suspensions. Mineral and metal prices typically fluctuate in response to changes in demand and the suppliers’ ability to react to these changes. As most metals and minerals are equal in nature, individual mining companies have very limited influence on the price of their product and are therefore considered “price takers”. Exchange rates and their fluctuations can also have an impact on the value of mineral production since most are priced in U.S. dollars.
| Commodity | 2020 | 2021 (p) | Change | |||
|---|---|---|---|---|---|---|
| Volume | Value | Volume | Value | Volume | Value | |
| (000 tonnes except where indicated) | ($ millions) | (000 tonnes except where indicated) | ($ millions) | (%) | (%) | |
| METALLIC MINERALS | ||||||
| Copper | 579 | 4,212 | 542 | 4,507 | -6.4 | 7.0 |
| Gold (000 kilograms) | 178 | 13,252 | 223 | 13,717 | 25.0 | 3.5 |
| Iron ore concentrates | 58,648 | 5,449 | 57,492 | 6,495 | -2.0 | 19.2 |
| Nickel | 158 | 2,688 | 134 | 2,597 | -15.5 | -3.4 |
| Zinc | 248 | 597 | 310 | 631 | 25.3 | 5.6 |
| Total | 31,635 | 35,657 | 12.7 | |||
| NON-METALLIC MINERALS | ||||||
| Diamonds (000 carats) | 14,390 | 1,321 | 17,353 | 1,677 | 20.6 | 27.0 |
| Potash (MoP) | 22,386 | 4,514 | 22,515 | 4,820 | 0.6 | 6.8 |
| Sand and gravel | 201,232 | 1,878 | 193,704 | 1,994 | -3.7 | 6.2 |
| Stone | 102,985 | 1,065 | 100,478 | 1,057 | -2.4 | -0.8 |
| Total non-metals |
10,777 | 11,884 | 10.3 | |||
| Coal | 40,824 | 7 | 41,809 | 7,965 | 2 | 101 |
| Total | 14,734 | 19,849 | 34.7 | |||
Sources: Natural Resources Canada, Statistics Canada.
MoP = muriate of potash, p = preliminary.
Notes and sources
Notes
- Data for 2021 are preliminary.
- Totals may be different because of rounding.
- Values are in Canadian dollars.
- Values reflect mineral shipments by Canadian mines as reported by the producer or based on annual average prices (consult Natural Resources Canada’s web page on techniques used to calculate data on mineral production in Canada for more details).
- Volumes reflect shipments from mines and, in some cases, may differ slightly from mine output.
Sources
- Statistics Canada, Annual Mineral Production Survey.
- Statistics Canada, Monthly Coal Supply and Disposition Survey.
- Natural Resources Canada; Principal Mineral Areas, Producing Mines, and Oil and Gas Fields in Canada.
- Company reports.
- Company websites.
Page details
- Date modified: