
Fuel Focus, May 2, 2014
Table of Contents
- National Overview
- Recent Developments
- Retail Gasoline Overview
- Wholesale Gasoline Prices
- Gasoline Refining and Marketing Margins
- Crude Oil Overview
- Supplement
- Download the report
National Overview
Canadian Retail Gasoline Prices Increased 2 Cents per Litre from Last Week
Canadian retail pump prices increased by 2 cents per litre to $1.40 per litre for the week ending April 29, 2014. This represents an increase of nearly 14 cents per litre compared to last year at the same period.
Rising gasoline pump prices relate to higher North American wholesale gasoline prices and the underlying price for world crude oil. These forces have currently pushed the retail pump price to its highest level since the price of $1.40 per litre on July 15, 2008. Lower-than-normal gasoline inventories in the U.S. and increased gasoline demand ahead of the summer driving season put upward pressure on prices.
Diesel fuel prices remain unchanged at $1.39 per litre compared to the previous week. This represents an increase of 16 cents per litre from the same period last year. Furnace oil prices rose by less than 1 cent per litre to $1.29 per litre from the previous week.
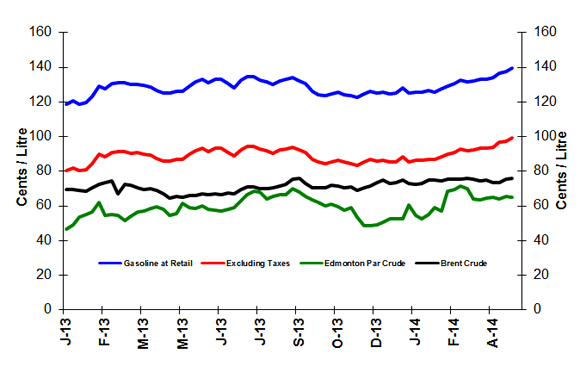
Figure 1: Crude Oil and Regular Gasoline Price Comparison
(National Average)
Text version
Figure 1
The graph shows prices in cents per litre for gasoline at retail, gasoline excluding taxes, and Edmonton Par and Brent crude oil prices. Gasoline prices ended the period of April 29, 2014, at 139.8 cents per litre, excluding taxes at 99.4 cents per litre, Edmonton Par at 65.0 cents per litre and Brent at 76.1 cents per litre.
| Dates | Gasoline at retail | Excluding Taxes | Edmonton Par crude | Brent crude |
|---|---|---|---|---|
| 01/01/2013 | 118.9 | 80.4 | 46.6 | 69.3 |
| 08/01/2013 | 120.6 | 81.9 | 49.4 | 69.5 |
| 15/01/2013 | 118.9 | 80.3 | 53.7 | 69.2 |
| 22/01/2013 | 119.7 | 81.1 | 55.2 | 68.7 |
| 29/01/2013 | 123.3 | 84.3 | 56.6 | 70.7 |
| 05/02/2013 | 129.2 | 89.7 | 61.9 | 72.5 |
| 12/02/2013 | 127.7 | 88.4 | 54.8 | 73.5 |
| 19/02/2013 | 130.5 | 90.9 | 55.3 | 74.6 |
| 26/02/2013 | 131.2 | 91.6 | 54.7 | 67.1 |
| 05/03/2013 | 131.2 | 91.6 | 51.8 | 72.5 |
| 12/03/2013 | 129.9 | 90.4 | 54.2 | 71.8 |
| 19/03/2013 | 130.1 | 90.7 | 56.7 | 70.6 |
| 26/03/2013 | 129.4 | 90.0 | 57.0 | 69.7 |
| 02/04/2013 | 128.7 | 89.3 | 58.4 | 69.9 |
| 09/04/2013 | 126.5 | 87.4 | 59.5 | 68.9 |
| 16/04/2013 | 125.0 | 86.0 | 58.0 | 67.0 |
| 23/04/2013 | 125.1 | 85.9 | 54.8 | 64.4 |
| 30/04/2013 | 126.3 | 87.0 | 55.8 | 65.5 |
| 07/05/2013 | 126.0 | 86.7 | 61.4 | 65.1 |
| 14/05/2013 | 129.3 | 89.8 | 59.1 | 66.1 |
| 21/05/2013 | 131.4 | 91.8 | 58.8 | 66.1 |
| 28/05/2013 | 132.9 | 93.2 | 60.0 | 66.9 |
| 04/06/2013 | 131.1 | 91.5 | 58.1 | 66.6 |
| 11/06/2013 | 132.9 | 93.2 | 57.8 | 66.8 |
| 18/06/2013 | 133.1 | 93.3 | 57.0 | 66.8 |
| 25/06/2013 | 130.5 | 91.0 | 58.0 | 67.4 |
| 02/07/2013 | 128.3 | 88.9 | 59.0 | 67.2 |
| 09/07/2013 | 132.4 | 92.6 | 63.1 | 69.6 |
| 16/07/2013 | 134.4 | 94.3 | 66.6 | 71.2 |
| 23/07/2013 | 134.7 | 94.6 | 68.7 | 71.1 |
| 30/07/2013 | 132.7 | 92.8 | 67.9 | 69.8 |
| 06/08/2013 | 131.5 | 91.7 | 64.1 | 70.1 |
| 13/08/2013 | 130.0 | 90.3 | 65.6 | 70.3 |
| 20/08/2013 | 132.0 | 92.2 | 66.4 | 71.3 |
| 27/08/2013 | 133.0 | 93.0 | 66.4 | 72.3 |
| 03/09/2013 | 133.9 | 93.8 | 70.2 | 75.5 |
| 10/09/2013 | 132.1 | 92.2 | 68.1 | 76.1 |
| 17/09/2013 | 130.6 | 90.8 | 65.8 | 73.0 |
| 24/09/2013 | 126.4 | 87.1 | 63.7 | 70.8 |
| 01/10/2013 | 124.3 | 85.2 | 61.9 | 70.3 |
| 08/10/2013 | 123.6 | 84.6 | 60.1 | 70.6 |
| 15/10/2013 | 124.8 | 85.6 | 60.9 | 71.9 |
| 22/10/2013 | 125.5 | 86.2 | 59.7 | 71.7 |
| 29/10/2013 | 124.4 | 85.2 | 57.4 | 70.6 |
| 05/11/2013 | 123.7 | 84.6 | 58.9 | 71.1 |
| 12/11/2013 | 122.6 | 83.6 | 53.5 | 69.0 |
| 19/11/2013 | 124.6 | 85.3 | 48.7 | 70.7 |
| 26/11/2013 | 126.4 | 86.9 | 48.6 | 71.8 |
| 03/12/2013 | 125.4 | 86.1 | 49.4 | 73.6 |
| 10/12/2013 | 125.9 | 86.5 | 50.9 | 74.9 |
| 17/12/2013 | 124.5 | 85.2 | 52.5 | 73.0 |
| 24/12/2013 | 125.0 | 85.6 | 52.6 | 73.5 |
| 31/12/2013 | 128.3 | 88.6 | 52.6 | 74.9 |
| 07/01/2014 | 125.0 | 85.6 | 60.6 | 73.0 |
| 14/01/2014 | 125.6 | 86.2 | 54.6 | 72.6 |
| 21/01/2014 | 125.7 | 86.3 | 52.8 | 73.2 |
| 28/01/2014 | 126.6 | 87.0 | 55.1 | 74.9 |
| 04/02/2014 | 125.9 | 86.7 | 59.0 | 75.1 |
| 11/02/2014 | 127.6 | 88.2 | 57.0 | 74.4 |
| 18/02/2014 | 129.3 | 89.8 | 68.5 | 75.3 |
| 25/02/2014 | 130.7 | 91.0 | 69.7 | 75.4 |
| 04/03/2014 | 132.5 | 92.7 | 71.5 | 75.4 |
| 11/03/2014 | 131.8 | 92.1 | 70.3 | 75.9 |
| 18/03/2014 | 132.0 | 92.3 | 64.3 | 75.4 |
| 25/03/2014 | 132.9 | 93.2 | 63.4 | 74.7 |
| 01/04/2014 | 132.9 | 93.2 | 64.4 | 75.2 |
| 08/04/2014 | 133.9 | 94.1 | 65.1 | 73.7 |
| 15/04/2014 | 136.8 | 96.7 | 64.2 | 73.8 |
| 22/04/2014 | 137.7 | 97.4 | 65.5 | 75.7 |
| 29/04/2014 | 139.8 | 99.4 | 65.0 | 76.1 |
Figure 2: Weekly Regular Gasoline Prices
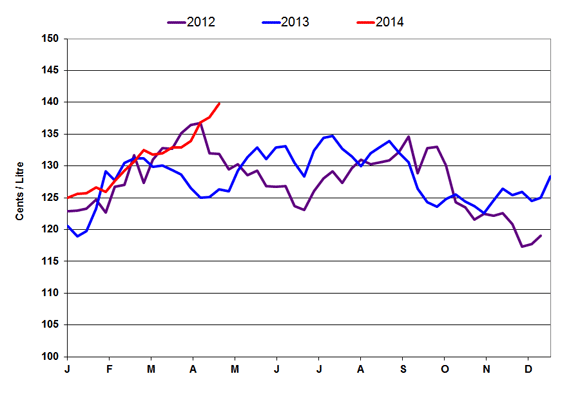
Text version
Figure 2
This graph shows the gasoline price trends from 2012 to 2014.
| Date | 2012 Gasoline at Retail | Date | 2013 Gasoline at Retail | Date | 2014 Gasoline at Retail |
|---|---|---|---|---|---|
| 12-01-03 | 120.60 | 13-01-01 | 118.90 | 13-12-31 | 128.30 |
| 12-01-10 | 122.90 | 13-01-08 | 120.60 | 14-01-07 | 125.00 |
| 12-01-17 | 123.00 | 13-01-15 | 118.90 | 14-01-14 | 125.60 |
| 12-01-24 | 123.30 | 13-01-22 | 119.70 | 14-01-21 | 125.70 |
| 12-01-31 | 124.70 | 13-01-29 | 123.30 | 14-01-28 | 126.60 |
| 12-02-07 | 122.70 | 13-02-05 | 129.20 | 14-02-04 | 125.90 |
| 12-02-14 | 126.70 | 13-02-12 | 127.70 | 14-02-11 | 127.60 |
| 12-02-21 | 127.00 | 13-02-19 | 130.50 | 14-02-18 | 129.30 |
| 12-02-28 | 131.70 | 13-02-26 | 131.20 | 14-02-25 | 130.70 |
| 12-03-06 | 127.30 | 13-03-05 | 131.20 | 14-03-04 | 132.50 |
| 12-03-13 | 131.00 | 13-03-12 | 129.90 | 14-03-11 | 131.80 |
| 12-03-20 | 132.80 | 13-03-19 | 130.10 | 14-03-18 | 132.00 |
| 12-03-27 | 132.70 | 13-03-26 | 129.40 | 14-03-25 | 132.90 |
| 12-04-03 | 135.10 | 13-04-02 | 128.70 | 14-04-01 | 132.90 |
| 12-04-10 | 136.40 | 13-04-09 | 126.50 | 14-04-08 | 133.90 |
| 12-04-17 | 136.70 | 13-04-16 | 125.00 | 14-04-15 | 136.80 |
| 12-04-24 | 132.00 | 13-04-23 | 125.10 | 14-04-22 | 137.70 |
| 12-05-01 | 131.90 | 13-04-30 | 126.30 | 14-04-29 | 139.80 |
| 12-05-08 | 129.50 | 13-05-07 | 126.00 | 14-05-06 | |
| 12-05-15 | 130.30 | 13-05-14 | 129.30 | 14-05-13 | |
| 12-05-22 | 128.50 | 13-05-21 | 131.40 | 14-05-20 | |
| 12-05-29 | 129.30 | 13-05-28 | 132.90 | 14-05-27 | |
| 12-06-05 | 126.80 | 13-06-04 | 131.10 | 14-06-03 | |
| 12-06-12 | 126.70 | 13-06-11 | 132.90 | 14-06-10 | |
| 12-06-19 | 126.80 | 13-06-18 | 133.10 | 14-06-17 | |
| 12-06-26 | 123.70 | 13-06-25 | 130.50 | 14-06-24 | |
| 12-07-03 | 123.10 | 13-07-02 | 128.30 | 14-07-01 | |
| 12-07-10 | 126.00 | 13-07-09 | 132.40 | 14-07-08 | |
| 12-07-17 | 128.00 | 13-07-16 | 134.40 | 14-07-15 | |
| 12-07-24 | 129.20 | 13-07-23 | 134.70 | 14-07-22 | |
| 12-07-31 | 127.30 | 13-07-30 | 132.70 | 14-07-29 | |
| 12-08-07 | 129.70 | 13-08-06 | 131.50 | 14-08-05 | |
| 12-08-14 | 131.00 | 13-08-13 | 130.00 | 14-08-12 | |
| 12-08-21 | 130.30 | 13-08-20 | 132.00 | 14-08-19 | |
| 12-08-28 | 130.60 | 13-08-27 | 133.00 | 14-08-26 | |
| 12-09-04 | 130.90 | 13-09-03 | 133.90 | 14-09-02 | |
| 12-09-11 | 132.20 | 13-09-10 | 132.10 | 14-09-09 | |
| 12-09-18 | 134.60 | 13-09-17 | 130.60 | 14-09-16 | |
| 12-09-25 | 128.90 | 13-09-24 | 126.40 | 14-09-23 | |
| 12-10-02 | 132.80 | 13-10-01 | 124.30 | 14-09-30 | |
| 12-10-09 | 133.00 | 13-10-08 | 123.60 | 14-10-07 | |
| 12-10-16 | 130.10 | 13-10-15 | 124.80 | 14-10-14 | |
| 12-10-23 | 124.30 | 13-10-22 | 125.50 | 14-10-21 | |
| 12-10-30 | 123.50 | 13-10-29 | 124.40 | 14-10-28 | |
| 12-11-06 | 121.60 | 13-11-05 | 123.70 | 14-11-04 | |
| 12-11-13 | 122.50 | 13-11-12 | 122.60 | 14-11-11 | |
| 12-11-20 | 122.20 | 13-11-19 | 124.60 | 14-11-18 | |
| 12-11-27 | 122.60 | 13-11-26 | 126.40 | 14-11-25 | |
| 12-12-04 | 120.90 | 13-12-03 | 125.40 | 14-12-02 | |
| 12-12-11 | 117.30 | 13-12-10 | 125.90 | 14-12-09 | |
| 12-12-18 | 117.70 | 13-12-17 | 124.50 | 14-12-16 | |
| 12-12-25 | 119.00 | 13-12-24 | 125.00 | 14-12-23 | |
| 13-12-31 | 128.30 | 14-12-30 |
| ¢/L | Week of: 2014-04-29 | Change from: Previous Week | Change from: Last Year |
|---|---|---|---|
| Gasoline | 139.8 | +2.2 | +13.5 |
| Diesel | 139.4 | 0.0 | +15.8 |
| Furnace Oil | 128.9 | +0.2 | +13.4 |
Source: NRCan
| 2014-04-29 | ¢/kilogram | ¢/L gasoline equivalent | ¢/L diesel equivalent |
|---|---|---|---|
| Vancouver | 114.6 | 75.6 | 78.4 |
| Edmonton | 115.1 | 75.9 | 78.7 |
| Toronto | 128.3 | 84.6 | 87.8 |
Source: ¢/kg Kent Marketing Services Limited
Recent Developments
- Report on Propane Supply and Pricing: A report on last winter’s increase in propane prices and causes of the supply shortage was released on April 30, 2014.
- U.S. Gasoline Price Up as Exports Increase: According to the U.S. Energy Information Administration, total petroleum exports, mostly gasoline and diesel, averaged about 3.6 million barrels a day for the week of April 14th, up 25% from the same period last year. A new pipeline, built to release a surplus of crude oil that was constrained in the U.S. Midwest, is now feeding oil to refineries on the Gulf Coast producing gasoline and diesel. While these fuels still make their way to the U.S. Southeast and the East Coast, growing amounts are being sold to Mexico, the Netherlands, Brazil and other countries. The push into these markets has been spurred by the U.S. oil boom. (Source: The Wall Street Journal, April 21, 2014)
- Foreign direct investment, 2013: The stock of Canadian direct investment abroad grew by 9.4% in 2013, reflecting both increased investment activity as well as the upward revaluation effects of a weaker Canadian dollar. Manufacturing maintained its position as the primary destination for foreign investment with a 30.5% share of overall investment, followed by mining and oil and gas extraction with 20.3%. (Source: The Daily )
Retail Gasoline Overview
The average Canadian pump price in selected cities for the four-week average ending April 29, 2014 was $1.37 per litre—an increase of 3 cents per litre from the last report on April 22, 2014. This represents an 11 cent-per-litre increase from the same period in 2013.
The four-week average crude oil price component of gasoline registered at 73 cents per litre, up by less than 1 cent per litre from two weeks ago. The crude oil price component of gasoline is up by 12 cents per litre from the same time last year.
Retail gasoline prices in most Western centres (Winnipeg to Vancouver), ranging from $1.25 to $1.49 per litre, rose by nearly 2 cents per litre compared to the previous report. Prices in Eastern centres (Toronto to St. John’s) increased on average by 3 cents per litre and ranged from $1.36 to $1.44 per litre.
Overall, the refining and marketing costs and margins component increased by 2 cents per litre to 24 cents per litre compared to two weeks ago, and are nearly 2 cents per litre lower than at the same time last year.
Figure 3: Regular Gasoline Pump Prices in Selected Cities Four-Week Average (April 8 to 29, 2014)
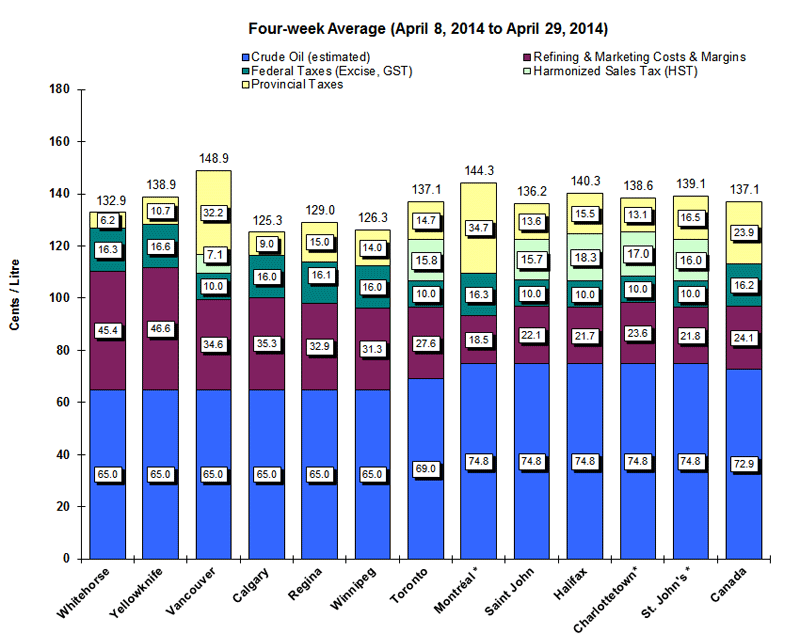
Text version
Figure 3
This graph shows the gasoline price components for 2 territories and 10 cities plus the national average.
| Whitehorse | Yellowknife | Vancouver | Calgary | Regina | Winnipeg | Toronto | Montreal* | Saint John* | Halifax* | Charlottetown* | St. John's* | Canada | |
|---|---|---|---|---|---|---|---|---|---|---|---|---|---|
| Pump Price | 132.9 | 138.9 | 148.9 | 125.3 | 129.0 | 126.3 | 137.1 | 144.3 | 136.2 | 140.3 | 138.6 | 139.1 | 137.1 |
| Crude (est.) | 65.0 | 65.0 | 65.0 | 65.0 | 65.0 | 65.0 | 69.0 | 74.8 | 74.8 | 74.8 | 74.8 | 74.8 | 72.9 |
| Federal Taxes | 16.3 | 16.6 | 10.0 | 16.0 | 16.1 | 16.0 | 10.0 | 16.3 | 10.0 | 10.0 | 10.0 | 10.0 | 16.2 |
| Provincial Tax | 6.2 | 10.7 | 32.2 | 9.0 | 15.0 | 14.0 | 14.7 | 34.7 | 13.6 | 15.5 | 13.1 | 16.5 | 23.9 |
| HST | 7.1 | 15.8 | 15.7 | 18.3 | 17.0 | 16.0 | |||||||
| Refining & Marketing Costs & Margins | 45.4 | 46.6 | 34.6 | 35.3 | 32.9 | 31.3 | 27.6 | 18.5 | 22.1 | 21.7 | 23.6 | 21.8 | 24.1 |
Source: NRCan
* Regulated Markets
Note: Toronto crude oil cost includes pipeline tolls of $4 per barrel for light crude oil from Edmonton to Sarnia, Ontario.
Rise in U.S. Gasoline Prices due to Typical Seasonal Factors
According to the U.S. Energy Information Administration (EIA), the recent gasoline price increase is mostly the result of an increase in crack spreads (the difference between the price of wholesale gasoline and the price of crude oil) attributable to typical seasonal factors such as refinery maintenance and higher travel-related demand as the driving season begins. In 2014, the average crack spread during the first four months of the year has been close to the five-year average.
Changes in the price of retail gasoline result from changes in both the price of crude oil and wholesale gasoline crack spreads. Crude oil prices do not display a seasonal pattern. Crack spreads for gasoline, however, are very seasonal.
This post-February increase is largely related to typical seasonal factors such as refinery maintenance, increasing demand from driving, and the switch to summer-grade gasoline, which is more costly to produce than winter-grade gasoline. Crack spreads then typically decline as those factors moderate, reaching the low point for the year during the fourth quarter.
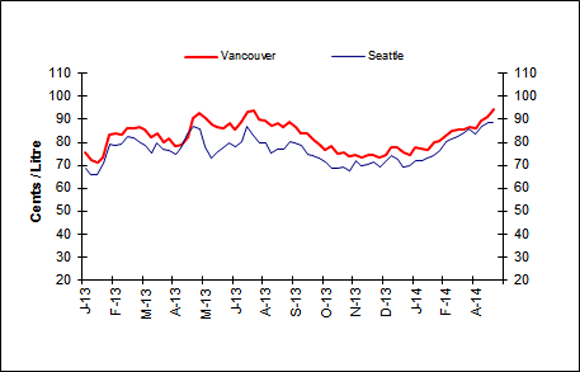
Source: U.S. EIA, This Week in PetroleumWholesale Gasoline Prices
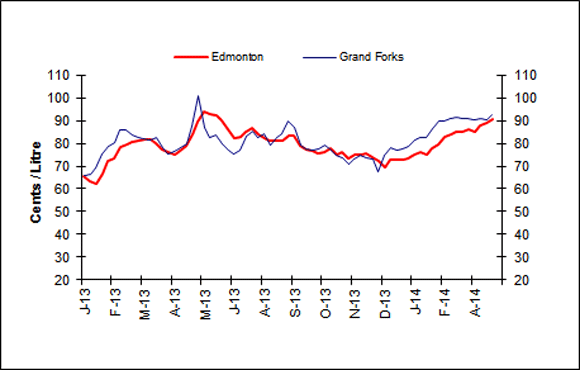
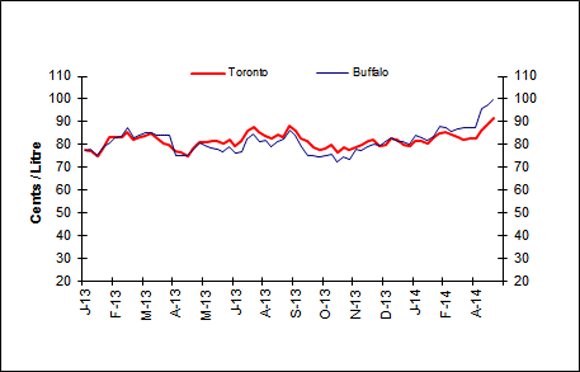
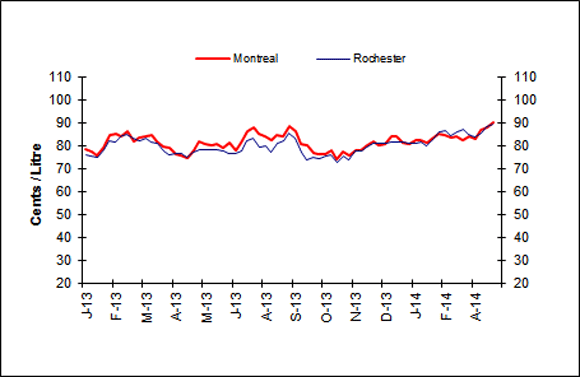
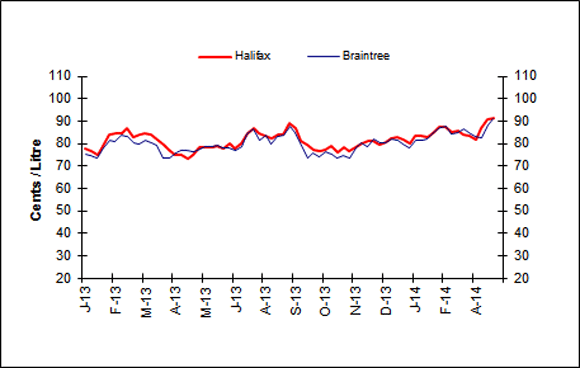
Wholesale gasoline prices ranged from 89 cents per litre to nearly $1 per litre in selected centres for the week of April 24, 2014. Wholesale gasoline prices, when compared to the previous week, increased in all centres.
In the Western centres, price changes ranged between increases of less than 1 cent to 3 cents per litre compared to the previous week, with prices ending at 89 to 95 cents per litre.
In the Eastern centres, price changes ranged between increases of 1 to 3 cents per litre compared to the previous week. Prices ended the period at 89 cents per litre to $1 per litre. The rise in wholesale gasoline prices in Buffalo is due to capacity-constrained pipelines and the relatively high cost of shipment using coastal tankers. The U.S. East coast is a large importer of gasoline from Europe where gasoline prices reflect the price of Brent.
In the last four weeks, wholesale prices in most Canadian and American selected centres have increased in the range of 2 cents to 13 cents per litre.
 |
 |
|
 |
 |
|
 |
Text version
Figure 4
This graph shows the trend in wholesale gasoline prices for selected centres in Canada and the U.S.
| DATE | Halifax | Braintree | Montreal | Rochester | Toronto | Buffalo | Edmonton | Grand Forks | Vancouver | Seattle |
|---|---|---|---|---|---|---|---|---|---|---|
| Thu 03-Jan-13 | 77.50 | 75.42 | 78.60 | 75.82 | 77.50 | 77.31 | 65.40 | 66.07 | 75.50 | 68.79 |
| Thu 10-Jan-13 | 76.70 | 74.48 | 77.40 | 75.49 | 76.90 | 77.88 | 63.40 | 66.67 | 72.40 | 65.77 |
| Thu 17-Jan-13 | 74.80 | 73.73 | 75.40 | 74.81 | 75.00 | 74.96 | 62.40 | 69.13 | 70.90 | 65.72 |
| Thu 13-Dec-12 | 72.10 | 70.22 | 74.90 | 71.94 | 73.90 | 77.52 | 67.70 | 64.43 | 70.50 | 65.70 |
| Thu 24-Jan-13 | 79.00 | 78.00 | 79.00 | 78.15 | 78.30 | 78.93 | 66.80 | 75.06 | 73.50 | 70.59 |
| Thu 31-Jan-13 | 84.10 | 81.70 | 84.70 | 81.81 | 83.50 | 80.51 | 72.50 | 78.85 | 83.40 | 79.19 |
| Thu 07-Feb-13 | 84.60 | 80.98 | 85.10 | 81.47 | 83.20 | 83.16 | 73.10 | 80.16 | 84.00 | 78.87 |
| Thu 14-Feb-13 | 84.50 | 83.61 | 84.20 | 84.35 | 83.20 | 83.55 | 78.10 | 86.03 | 83.30 | 79.18 |
| Thu 21-Feb-13 | 86.70 | 83.01 | 85.90 | 84.51 | 85.40 | 87.44 | 79.70 | 85.90 | 86.00 | 82.60 |
| Thu 28-Feb-13 | 82.80 | 80.41 | 81.90 | 83.34 | 81.90 | 83.14 | 80.50 | 83.70 | 86.20 | 81.99 |
| Thu 07-Mar-13 | 84.10 | 80.00 | 83.60 | 82.22 | 83.30 | 84.09 | 81.00 | 82.56 | 86.90 | 80.15 |
| Thu 14-Mar-13 | 84.60 | 81.52 | 84.00 | 83.10 | 83.90 | 85.12 | 81.70 | 82.24 | 85.40 | 78.61 |
| Thu 21-Mar-13 | 84.10 | 80.55 | 84.50 | 81.59 | 84.80 | 84.95 | 81.80 | 81.66 | 82.10 | 75.28 |
| Thu 28-Mar-13 | 82.00 | 79.08 | 81.50 | 80.79 | 82.60 | 84.24 | 80.20 | 82.51 | 83.80 | 79.62 |
| Thu 04-Apr-13 | 79.40 | 73.32 | 79.50 | 77.54 | 80.60 | 84.10 | 77.40 | 78.17 | 80.20 | 77.14 |
| Thu 11-Apr-13 | 77.30 | 73.36 | 78.90 | 75.92 | 79.80 | 83.84 | 75.90 | 75.52 | 81.50 | 76.23 |
| Thu 18-Apr-13 | 74.70 | 75.92 | 76.30 | 76.28 | 77.10 | 75.04 | 74.90 | 76.41 | 78.50 | 74.77 |
| Thu 25-Apr-13 | 74.80 | 77.01 | 75.90 | 76.42 | 76.70 | 75.40 | 76.80 | 78.08 | 79.00 | 77.56 |
| Thu 02-May-13 | 73.50 | 76.65 | 74.50 | 75.00 | 75.00 | 75.38 | 78.80 | 79.70 | 82.00 | 83.51 |
| Thu 09-May-13 | 75.10 | 76.22 | 77.60 | 77.03 | 78.50 | 77.88 | 83.90 | 87.57 | 90.80 | 87.15 |
| Thu 16-May-13 | 78.10 | 77.25 | 81.50 | 78.21 | 80.90 | 80.54 | 89.30 | 101.10 | 92.50 | 85.64 |
| Thu 23-May-13 | 78.60 | 78.37 | 80.50 | 78.09 | 81.30 | 79.53 | 94.20 | 86.80 | 90.30 | 78.24 |
| Thu 30-May-13 | 78.40 | 78.36 | 79.80 | 77.90 | 81.40 | 78.43 | 92.60 | 82.64 | 87.60 | 73.33 |
| Thu 06-Jun-13 | 78.70 | 78.91 | 80.50 | 78.17 | 81.60 | 78.16 | 92.40 | 83.64 | 86.60 | 76.00 |
| Thu 13-Jun-13 | 77.80 | 78.32 | 78.90 | 77.45 | 80.60 | 76.84 | 90.20 | 79.79 | 86.00 | 77.78 |
| Thu 20-Jun-13 | 80.10 | 78.00 | 81.00 | 76.50 | 82.00 | 79.30 | 86.20 | 76.78 | 88.10 | 79.78 |
| Thu 27-Jun-13 | 77.80 | 76.96 | 78.10 | 76.22 | 79.40 | 76.41 | 82.40 | 75.29 | 85.70 | 77.93 |
| Thu 04-Jul-13 | 79.80 | 78.53 | 81.30 | 77.56 | 81.80 | 76.93 | 82.70 | 77.19 | 88.70 | 80.47 |
| Thu 11-Jul-13 | 84.60 | 84.52 | 86.30 | 82.08 | 85.80 | 82.51 | 85.00 | 83.36 | 93.40 | 87.07 |
| Thu 18-Jul-13 | 87.10 | 86.48 | 87.80 | 82.88 | 87.80 | 84.45 | 86.70 | 85.15 | 93.90 | 82.94 |
| Thu 25-Jul-15 | 84.40 | 81.63 | 84.80 | 79.09 | 85.40 | 81.21 | 84.10 | 82.55 | 89.90 | 79.53 |
| Thu 01-Aug-13 | 83.20 | 83.68 | 84.00 | 80.06 | 84.10 | 81.93 | 82.00 | 84.32 | 89.50 | 79.81 |
| Thu 08-Aug-13 | 82.30 | 79.58 | 82.20 | 76.89 | 82.60 | 78.85 | 81.10 | 78.95 | 87.00 | 75.45 |
| Thu 15-Aug-13 | 84.20 | 83.01 | 84.40 | 80.94 | 84.20 | 81.32 | 81.20 | 82.30 | 88.50 | 76.76 |
| Thu 22-Aug-13 | 83.90 | 83.75 | 84.00 | 82.03 | 83.50 | 82.16 | 80.90 | 84.32 | 86.40 | 76.73 |
| Thu 29-Aug-13 | 88.90 | 87.42 | 88.30 | 85.55 | 88.10 | 86.41 | 83.40 | 89.62 | 88.90 | 80.31 |
| Thu 05-Sep-13 | 86.70 | 84.77 | 86.20 | 83.13 | 85.90 | 84.03 | 83.20 | 86.81 | 86.50 | 79.97 |
| Thu 12-Sep-13 | 81.00 | 79.52 | 80.90 | 77.16 | 82.90 | 78.97 | 79.20 | 79.37 | 84.00 | 78.65 |
| Thu 19-Sep-13 | 79.70 | 73.77 | 80.20 | 73.60 | 81.60 | 75.45 | 77.10 | 77.32 | 83.70 | 74.59 |
| Thu 26-Sep-13 | 77.40 | 75.99 | 77.00 | 74.69 | 78.70 | 75.25 | 76.50 | 76.96 | 80.90 | 74.43 |
| Thu 03-Oct-13 | 76.50 | 73.93 | 76.00 | 74.33 | 77.80 | 74.45 | 75.60 | 77.48 | 79.10 | 73.09 |
| Thu 10-Oct-13 | 77.00 | 76.23 | 76.40 | 75.22 | 78.20 | 75.24 | 76.20 | 79.28 | 76.80 | 71.32 |
| Thu 17-Oct-13 | 78.80 | 75.48 | 78.00 | 75.66 | 79.80 | 75.64 | 77.80 | 77.39 | 78.30 | 68.82 |
| Thu 24-Oct-13 | 76.30 | 73.26 | 74.20 | 72.60 | 76.40 | 76.40 | 75.10 | 74.67 | 75.20 | 68.55 |
| Thu 31-Oct-13 | 78.40 | 74.83 | 77.40 | 75.50 | 78.90 | 74.66 | 75.90 | 73.89 | 75.50 | 69.29 |
| Thu 07-Nov-13 | 76.50 | 73.29 | 75.40 | 73.47 | 77.70 | 73.62 | 73.10 | 70.87 | 73.90 | 67.58 |
| Thu 14-Nov-13 | 78.50 | 78.01 | 77.70 | 77.49 | 78.90 | 78.23 | 74.80 | 73.14 | 74.60 | 71.77 |
| Thu 21-Nov-13 | 80.00 | 80.43 | 77.80 | 77.74 | 79.80 | 77.16 | 75.30 | 74.96 | 73.50 | 69.75 |
| Thu 28-Nov-13 | 81.30 | 78.79 | 80.20 | 79.06 | 81.60 | 79.32 | 75.50 | 73.46 | 74.60 | 70.20 |
| Thu 05-Dec-13 | 81.30 | 81.98 | 81.70 | 80.77 | 81.90 | 79.95 | 74.00 | 73.04 | 74.70 | 71.18 |
| Thu 12-Dec-13 | 79.30 | 80.57 | 80.00 | 80.76 | 79.60 | 79.52 | 72.30 | 67.30 | 73.60 | 69.01 |
| Thu 19-Dec-13 | 80.60 | 80.41 | 80.60 | 80.76 | 79.80 | 81.20 | 69.40 | 74.95 | 74.60 | 71.49 |
| Thu 26-Dec-13 | 82.50 | 82.08 | 84.20 | 81.35 | 82.80 | 82.75 | 72.70 | 77.90 | 77.80 | 73.92 |
| Thu 02-Jan-14 | 83.00 | 81.60 | 83.90 | 81.26 | 82.40 | 81.49 | 72.90 | 77.05 | 77.80 | 72.33 |
| Thu 09-Jan-14 | 81.80 | 79.89 | 81.30 | 81.25 | 80.00 | 81.12 | 72.60 | 77.50 | 75.40 | 69.37 |
| Thu 16-Jan-14 | 79.90 | 78.10 | 80.80 | 80.69 | 79.20 | 80.27 | 73.60 | 78.54 | 74.50 | 69.50 |
| Thu 23-Jan-14 | 83.30 | 81.27 | 82.50 | 80.86 | 81.50 | 84.27 | 75.20 | 81.56 | 77.80 | 72.04 |
| Thu 30-Jan-14 | 83.60 | 81.57 | 82.50 | 81.27 | 81.60 | 84.27 | 75.90 | 82.75 | 77.20 | 72.24 |
| Thu 06-Feb-14 | 83.00 | 81.77 | 81.00 | 79.85 | 80.60 | 82.00 | 75.00 | 82.38 | 76.40 | 73.02 |
| Thu 13-Feb-14 | 85.40 | 84.58 | 83.50 | 82.68 | 83.50 | 83.54 | 77.70 | 86.24 | 79.80 | 74.26 |
| Thu 20-Feb-14 | 87.30 | 87.33 | 84.90 | 85.83 | 85.20 | 88.00 | 79.60 | 89.82 | 80.40 | 76.56 |
| Thu 27-Feb-14 | 87.60 | 87.64 | 84.60 | 86.29 | 85.70 | 87.43 | 83.00 | 89.92 | 82.60 | 80.13 |
| Thu 06-Mar-14 | 85.10 | 84.56 | 83.30 | 84.37 | 84.20 | 85.84 | 84.10 | 91.11 | 84.80 | 81.55 |
| Thu 13-Mar-14 | 85.90 | 84.97 | 83.80 | 85.80 | 83.50 | 86.75 | 85.30 | 91.48 | 85.40 | 82.23 |
| Thu 20-Mar-14 | 84.20 | 86.34 | 82.40 | 86.82 | 82.10 | 87.62 | 85.00 | 91.13 | 85.70 | 84.11 |
| Thu 27-Mar-14 | 83.40 | 84.62 | 84.62 | 84.72 | 82.80 | 87.34 | 85.90 | 90.80 | 86.80 | 85.82 |
| Thu 03-Apr-14 | 81.90 | 82.99 | 83.10 | 83.94 | 82.50 | 87.19 | 85.30 | 90.11 | 85.90 | 83.37 |
| Thu 10-Apr-14 | 86.70 | 82.53 | 86.50 | 85.36 | 86.00 | 95.70 | 88.00 | 91.01 | 89.40 | 86.71 |
| Thu 17-Apr-14 | 90.60 | 88.47 | 87.90 | 88.00 | 88.70 | 97.62 | 88.00 | 90.24 | 91.20 | 88.76 |
| Thu 24-Apr-14 | 91.30 | 91.03 | 90.10 | 89.26 | 91.40 | 99.92 | 90.50 | 90.66 | 94.50 | 88.79 |
Sources: NRCan, Bloomberg Oil Buyers Guide
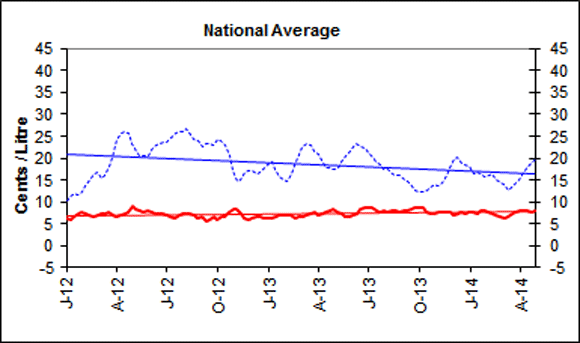
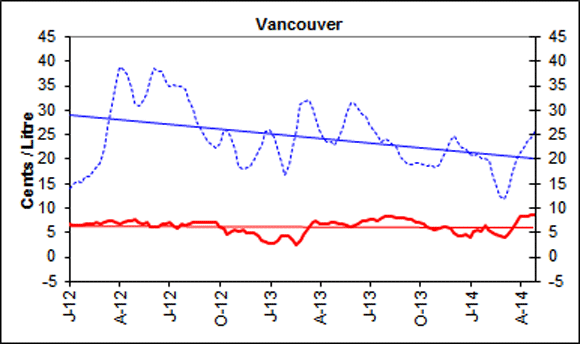
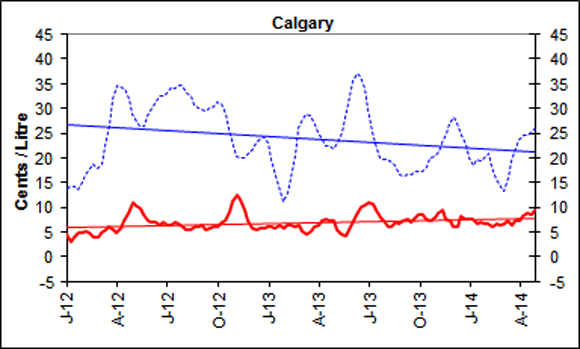
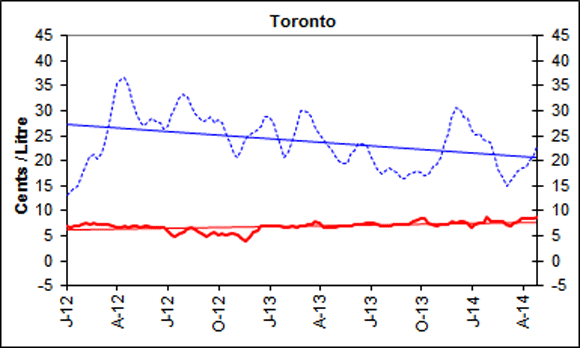
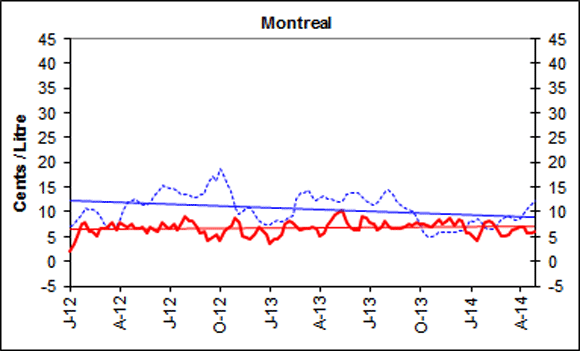
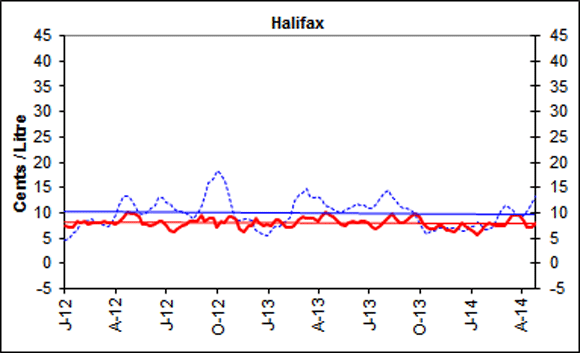
Gasoline Refining and Marketing Margins
Four-week rolling averages are used for gasoline refining and marketing margins.
These refining margins refer to the difference between the cost of crude oil and the wholesale price at which a refiner can sell gasoline. The margin includes the costs associated with refining the product as well as a profit for the refiner.
Nationally, marketing margins, defined as the pump price, excluding all taxes, minus the wholesale or rack price, rose to 8 cents per litre, up 0.2 cents per litre from the same period last year.
Although it represents a small portion of the total pump price, the marketing margin can vary significantly from city to city and region to region.
 |
 |
|
 |
 |
|
 |
 |
Text version
Figure 5
These graphs show the trend in refining and marketing costs and margins for selected centres in Canada and the national average.
| 4-week rolling average | Canada | Vancouver | Calgary | Toronto | Montreal | Halifax | ||||||
|---|---|---|---|---|---|---|---|---|---|---|---|---|
| Marketing Margin | Refining Margin | Marketing Margin | Refining Margin | Marketing Margin | Refining Margin | Marketing Margin | Refining Margin | Marketing Margin | Refining Margin | Marketing Margin | Refining Margin | |
| 2012-01-03 | 6.1 | 10.4 | 6.9 | 14.1 | 4.6 | 13.9 | 6.9 | 13.0 | 1.9 | 7.1 | 7.3 | 4.4 |
| 2012-01-10 | 6.1 | 11.3 | 6.4 | 14.9 | 3.0 | 14.2 | 6.7 | 13.8 | 3.7 | 7.5 | 7.1 | 5.0 |
| 2012-01-17 | 6.5 | 11.8 | 6.4 | 15.4 | 4.0 | 14.1 | 6.9 | 14.5 | 5.1 | 8.7 | 7.2 | 6.0 |
| 2012-01-24 | 7.3 | 11.5 | 6.3 | 15.1 | 5.0 | 13.6 | 7.0 | 14.9 | 7.5 | 9.1 | 8.3 | 6.5 |
| 2012-01-31 | 7.6 | 12.3 | 6.7 | 16.6 | 5.0 | 15.0 | 7.4 | 17.3 | 8.0 | 10.6 | 8.2 | 8.1 |
| 2012-02-07 | 7.2 | 13.6 | 6.8 | 16.6 | 5.2 | 16.5 | 7.4 | 18.9 | 6.2 | 10.6 | 8.4 | 8.2 |
| 2012-02-14 | 7.0 | 15.2 | 6.8 | 17.4 | 4.8 | 17.9 | 7.3 | 20.8 | 6.1 | 10.3 | 7.8 | 8.4 |
| 2012-02-21 | 6.6 | 16.2 | 6.9 | 18.5 | 3.9 | 18.6 | 7.5 | 21.4 | 5.1 | 10.1 | 7.9 | 8.7 |
| 2012-02-28 | 6.8 | 16.9 | 6.8 | 19.3 | 3.9 | 17.7 | 7.3 | 20.3 | 6.5 | 8.8 | 8.0 | 8.2 |
| 2012-03-06 | 7.1 | 15.4 | 7.2 | 22.2 | 4.9 | 18.9 | 7.3 | 21.6 | 6.7 | 7.7 | 8.1 | 7.9 |
| 2012-03-13 | 7.3 | 16.2 | 7.5 | 26.6 | 5.6 | 22.4 | 7.4 | 23.8 | 6.9 | 6.9 | 8.4 | 7.6 |
| 2012-03-20 | 7.5 | 18.1 | 7.5 | 31.2 | 6.0 | 26.7 | 7.2 | 27.6 | 7.8 | 6.4 | 8.0 | 7.3 |
| 2012-03-27 | 6.9 | 20.1 | 7.1 | 36.2 | 5.6 | 31.9 | 6.9 | 32.5 | 6.3 | 6.9 | 8.0 | 7.7 |
| 2012-04-03 | 6.8 | 24.3 | 6.8 | 39.0 | 4.8 | 34.7 | 6.7 | 35.3 | 7.8 | 8.7 | 7.6 | 9.6 |
| 2012-04-10 | 7.1 | 25.8 | 7.1 | 38.3 | 5.8 | 34.4 | 6.8 | 36.2 | 7.4 | 10.4 | 8.4 | 11.4 |
| 2012-04-17 | 7.5 | 26.2 | 7.5 | 37.4 | 7.2 | 33.9 | 7.0 | 36.6 | 6.9 | 12.1 | 8.8 | 13.1 |
| 2012-04-24 | 8.0 | 25.7 | 7.4 | 34.4 | 9.0 | 31.8 | 6.7 | 34.9 | 7.6 | 12.4 | 10.0 | 13.3 |
| 2012-05-01 | 9.3 | 23.3 | 7.8 | 31.6 | 11.0 | 28.9 | 7.0 | 32.0 | 6.5 | 12.6 | 9.8 | 12.6 |
| 2012-05-08 | 8.7 | 21.7 | 7.2 | 31.0 | 10.5 | 27.3 | 6.9 | 29.5 | 6.6 | 12.0 | 9.8 | 11.3 |
| 2012-05-15 | 8.4 | 20.7 | 6.8 | 32.0 | 9.7 | 26.3 | 6.6 | 27.5 | 6.8 | 11.2 | 9.2 | 10.1 |
| 2012-05-22 | 8.0 | 20.6 | 7.0 | 33.2 | 8.6 | 26.3 | 7.0 | 27.0 | 5.9 | 11.4 | 7.8 | 9.7 |
| 2012-05-29 | 8.1 | 20.5 | 6.2 | 37.0 | 7.4 | 28.4 | 6.8 | 28.0 | 7.0 | 12.0 | 7.8 | 10.1 |
| 2012-06-05 | 8.0 | 21.8 | 6.1 | 38.6 | 7.1 | 30.0 | 6.5 | 28.5 | 6.3 | 13.2 | 7.6 | 10.9 |
| 2012-06-12 | 7.5 | 22.8 | 6.2 | 37.9 | 7.0 | 30.9 | 6.7 | 27.8 | 6.2 | 14.0 | 7.9 | 11.5 |
| 2012-06-19 | 7.8 | 23.3 | 6.7 | 38.0 | 6.3 | 32.5 | 6.7 | 27.5 | 8.0 | 15.3 | 8.3 | 12.9 |
| 2012-06-26 | 7.6 | 23.7 | 6.8 | 35.7 | 6.8 | 32.5 | 6.6 | 26.5 | 6.9 | 15.2 | 8.4 | 12.9 |
| 2012-07-03 | 7.3 | 23.7 | 7.0 | 34.9 | 6.5 | 33.0 | 6.1 | 27.0 | 6.6 | 14.8 | 7.3 | 12.1 |
| 2012-07-10 | 7.0 | 24.5 | 6.6 | 35.3 | 6.3 | 34.4 | 5.3 | 29.0 | 7.4 | 14.7 | 6.4 | 11.8 |
| 2012-07-17 | 6.6 | 25.8 | 5.9 | 34.9 | 7.0 | 34.0 | 4.9 | 30.9 | 6.3 | 14.0 | 6.2 | 10.7 |
| 2012-07-24 | 7.1 | 25.9 | 6.7 | 35.0 | 6.6 | 34.6 | 5.4 | 32.5 | 7.7 | 13.6 | 6.9 | 10.3 |
| 2012-07-31 | 7.6 | 26.1 | 6.6 | 34.3 | 6.2 | 34.6 | 5.8 | 33.3 | 9.0 | 13.4 | 7.5 | 10.4 |
| 2012-08-07 | 7.5 | 26.6 | 6.8 | 32.0 | 5.3 | 33.2 | 6.3 | 32.7 | 8.1 | 13.5 | 7.6 | 9.9 |
| 2012-08-14 | 7.6 | 25.4 | 7.1 | 30.2 | 5.5 | 32.4 | 6.7 | 31.2 | 8.2 | 13.0 | 8.4 | 9.3 |
| 2012-08-21 | 7.2 | 24.5 | 7.1 | 27.9 | 6.1 | 30.7 | 6.3 | 29.3 | 6.9 | 12.8 | 8.4 | 8.8 |
| 2012-08-28 | 6.5 | 23.9 | 7.1 | 26.4 | 6.0 | 30.0 | 5.8 | 28.8 | 5.8 | 13.6 | 8.2 | 9.9 |
| 2012-09-04 | 6.5 | 22.7 | 7.1 | 25.2 | 6.5 | 29.7 | 5.5 | 27.9 | 6.1 | 13.4 | 9.6 | 10.9 |
| 2012-09-11 | 5.6 | 23.3 | 7.0 | 23.6 | 5.3 | 29.3 | 4.8 | 28.3 | 4.2 | 15.9 | 8.4 | 13.5 |
| 2012-09-18 | 6.1 | 23.3 | 7.2 | 22.8 | 5.9 | 30.1 | 5.4 | 28.8 | 4.8 | 17.3 | 9.0 | 15.8 |
| 2012-09-25 | 6.5 | 22.9 | 7.0 | 22.3 | 6.2 | 30.4 | 5.7 | 27.6 | 5.4 | 16.4 | 8.8 | 16.4 |
| 2012-10-02 | 5.9 | 24.2 | 6.3 | 23.3 | 6.0 | 31.2 | 5.3 | 28.3 | 4.3 | 18.7 | 7.0 | 18.5 |
| 2012-10-09 | 6.6 | 23.8 | 5.7 | 25.6 | 6.9 | 31.1 | 5.4 | 27.5 | 6.1 | 17.4 | 8.4 | 17.9 |
| 2012-10-16 | 6.7 | 22.9 | 4.7 | 26.6 | 7.3 | 29.3 | 5.2 | 26.3 | 6.8 | 15.7 | 8.0 | 16.6 |
| 2012-10-23 | 7.5 | 20.4 | 5.1 | 24.4 | 9.1 | 25.9 | 5.5 | 23.7 | 7.2 | 14.0 | 9.3 | 14.3 |
| 2012-10-30 | 8.5 | 17.2 | 5.5 | 21.6 | 11.4 | 22.0 | 5.5 | 20.9 | 8.6 | 10.3 | 9.3 | 10.3 |
| 2012-11-06 | 8.3 | 14.8 | 5.1 | 18.7 | 12.4 | 20.3 | 5.1 | 20.8 | 7.9 | 9.6 | 8.5 | 8.6 |
| 2012-11-13 | 7.3 | 15.1 | 5.4 | 17.2 | 11.5 | 19.3 | 4.6 | 21.7 | 5.2 | 10.4 | 6.7 | 8.7 |
| 2012-11-20 | 6.3 | 16.8 | 5.1 | 18.2 | 9.4 | 20.0 | 4.1 | 24.4 | 4.7 | 10.8 | 6.1 | 8.9 |
| 2012-11-27 | 6.0 | 17.2 | 5.0 | 18.7 | 7.3 | 21.2 | 4.9 | 25.5 | 4.4 | 10.8 | 7.4 | 8.9 |
| 2012-12-04 | 6.2 | 17.2 | 4.8 | 20.1 | 5.8 | 21.8 | 5.8 | 25.7 | 5.5 | 9.9 | 7.5 | 8.6 |
| 2012-12-11 | 6.5 | 16.3 | 4.3 | 19.3 | 5.5 | 21.0 | 6.1 | 24.0 | 6.9 | 7.9 | 9.1 | 6.3 |
| 2012-12-18 | 6.7 | 16.6 | 3.6 | 23.2 | 5.8 | 24.0 | 7.1 | 27.1 | 6.5 | 7.8 | 8.0 | 6.0 |
| 2012-12-25 | 6.4 | 17.7 | 3.0 | 25.6 | 5.8 | 24.4 | 6.8 | 28.8 | 5.4 | 7.5 | 7.4 | 5.8 |
| 2013-01-01 | 6.2 | 18.6 | 2.8 | 25.9 | 6.1 | 23.1 | 7.1 | 28.9 | 3.6 | 7.3 | 7.7 | 5.6 |
| 2013-01-08 | 6.4 | 19.0 | 2.7 | 24.5 | 6.0 | 19.8 | 7.1 | 27.6 | 4.4 | 8.0 | 7.5 | 6.6 |
| 2013-01-15 | 6.5 | 17.5 | 3.5 | 22.2 | 5.9 | 16.3 | 6.8 | 25.5 | 4.6 | 8.2 | 8.5 | 7.2 |
| 2013-01-22 | 6.9 | 15.6 | 4.4 | 20.2 | 6.3 | 14.3 | 7.0 | 23.9 | 5.5 | 8.3 | 8.5 | 7.6 |
| 2013-01-29 | 6.9 | 15.0 | 4.2 | 16.8 | 5.8 | 11.0 | 6.5 | 20.7 | 7.7 | 8.4 | 7.6 | 7.9 |
| 2013-02-05 | 7.0 | 14.6 | 4.2 | 18.2 | 6.4 | 12.3 | 6.8 | 21.1 | 8.1 | 9.5 | 7.1 | 9.2 |
| 2013-02-12 | 6.8 | 16.2 | 3.4 | 22.2 | 6.4 | 16.1 | 6.9 | 23.6 | 7.8 | 9.4 | 7.1 | 9.1 |
| 2013-02-19 | 6.4 | 18.5 | 2.4 | 25.6 | 6.2 | 19.9 | 6.8 | 25.7 | 7.0 | 11.0 | 7.4 | 10.8 |
| 2013-02-26 | 6.6 | 20.8 | 3.4 | 31.1 | 6.3 | 26.0 | 7.0 | 30.0 | 6.3 | 13.7 | 8.6 | 13.6 |
| 2013-03-05 | 6.7 | 22.7 | 4.7 | 32.0 | 5.2 | 27.8 | 7.0 | 30.1 | 6.7 | 13.9 | 9.3 | 14.0 |
| 2013-03-12 | 6.8 | 23.3 | 5.8 | 32.1 | 4.7 | 28.9 | 7.1 | 29.7 | 6.8 | 14.3 | 9.0 | 14.6 |
| 2013-03-19 | 7.2 | 23.1 | 7.0 | 31.5 | 5.1 | 29.1 | 7.4 | 29.4 | 6.8 | 12.3 | 9.1 | 12.8 |
| 2013-03-26 | 7.5 | 21.7 | 7.3 | 27.8 | 6.0 | 26.5 | 7.8 | 26.4 | 6.7 | 12.3 | 9.0 | 12.9 |
| 2013-04-02 | 7.1 | 20.9 | 6.9 | 26.5 | 6.4 | 25.8 | 7.5 | 25.6 | 5.2 | 12.6 | 8.4 | 12.9 |
| 2013-04-09 | 7.3 | 19.4 | 6.8 | 24.2 | 7.4 | 23.6 | 6.8 | 24.1 | 5.7 | 13.2 | 9.2 | 12.6 |
| 2013-04-16 | 7.8 | 17.9 | 6.9 | 22.7 | 7.7 | 21.6 | 6.7 | 22.2 | 7.2 | 11.6 | 10.1 | 10.5 |
| 2013-04-23 | 7.9 | 17.6 | 7.0 | 23.6 | 7.3 | 22.4 | 6.6 | 22.5 | 8.4 | 12.6 | 9.5 | 11.1 |
| 2013-04-30 | 8.2 | 17.6 | 7.2 | 24.1 | 7.4 | 22.9 | 6.8 | 22.2 | 9.5 | 12.2 | 9.2 | 10.6 |
| 2013-05-07 | 7.8 | 17.9 | 6.8 | 24.4 | 5.6 | 23.0 | 6.9 | 20.1 | 9.9 | 12.1 | 8.3 | 10.3 |
| 2013-05-14 | 7.4 | 19.2 | 6.7 | 27.0 | 4.4 | 25.1 | 6.9 | 19.3 | 10.2 | 12.4 | 7.8 | 10.2 |
| 2013-05-21 | 6.6 | 20.7 | 6.3 | 29.2 | 4.1 | 28.2 | 7.0 | 19.6 | 7.7 | 13.4 | 7.6 | 10.7 |
| 2013-05-28 | 6.7 | 21.3 | 6.3 | 31.3 | 5.4 | 32.2 | 7.0 | 20.8 | 6.9 | 13.8 | 8.1 | 10.9 |
| 2013-06-04 | 7.0 | 22.6 | 6.6 | 31.4 | 7.2 | 35.6 | 7.2 | 22.0 | 6.3 | 13.7 | 8.4 | 11.2 |
| 2013-06-11 | 7.3 | 23.3 | 6.8 | 29.9 | 8.5 | 36.8 | 7.2 | 22.9 | 6.4 | 13.9 | 8.1 | 11.8 |
| 2013-06-04 | 7.0 | 22.6 | 6.6 | 31.4 | 7.2 | 35.6 | 7.2 | 22.0 | 6.3 | 13.7 | 8.4 | 11.2 |
| 2013-06-11 | 7.3 | 23.3 | 6.8 | 29.9 | 8.5 | 36.8 | 7.2 | 22.9 | 6.4 | 13.9 | 8.1 | 11.8 |
| 2013-06-18 | 8.5 | 22.7 | 7.5 | 29.4 | 9.9 | 36.5 | 7.4 | 23.5 | 9.0 | 13.0 | 8.2 | 11.5 |
| 2013-06-25 | 8.7 | 22.2 | 7.5 | 29.0 | 10.4 | 34.3 | 7.6 | 23.4 | 8.8 | 12.4 | 8.3 | 11.5 |
| 2013-07-02 | 8.8 | 21.4 | 7.8 | 27.3 | 10.9 | 29.8 | 7.7 | 21.4 | 7.7 | 11.7 | 8.1 | 11.0 |
| 2013-07-09 | 8.6 | 21.3 | 7.6 | 27.5 | 10.8 | 26.9 | 7.5 | 21.2 | 7.5 | 12.1 | 7.2 | 11.7 |
| 2013-07-16 | 7.9 | 19.3 | 7.3 | 24.9 | 9.3 | 21.9 | 7.2 | 18.2 | 6.3 | 12.1 | 6.9 | 11.9 |
| 2013-07-23 | 7.8 | 18.3 | 8.0 | 23.9 | 8.0 | 20.3 | 7.0 | 17.8 | 7.0 | 12.7 | 7.4 | 12.5 |
| 2013-07-30 | 7.9 | 17.5 | 8.2 | 24.0 | 7.4 | 19.6 | 7.1 | 18.0 | 8.0 | 14.0 | 8.0 | 13.8 |
| 2013-08-06 | 7.6 | 17.4 | 8.2 | 23.6 | 6.2 | 19.4 | 6.9 | 18.2 | 7.1 | 14.5 | 9.0 | 14.4 |
| 2013-08-13 | 7.8 | 16.4 | 8.4 | 22.8 | 6.2 | 18.9 | 7.2 | 17.9 | 6.8 | 13.4 | 9.7 | 13.2 |
| 2013-08-20 | 7.9 | 16.1 | 8.0 | 23.0 | 6.9 | 18.6 | 7.3 | 17.8 | 6.6 | 12.7 | 8.8 | 12.7 |
| 2013-08-27 | 7.8 | 16.2 | 8.0 | 20.5 | 6.8 | 16.7 | 7.4 | 16.4 | 6.6 | 11.3 | 8.0 | 11.5 |
| 2013-09-03 | 7.9 | 15.2 | 8.1 | 19.5 | 7.2 | 16.4 | 7.3 | 16.5 | 6.9 | 11.4 | 8.1 | 11.7 |
| 2013-09-10 | 8.0 | 14.6 | 7.8 | 18.9 | 7.6 | 16.7 | 7.3 | 17.3 | 7.5 | 10.4 | 8.8 | 10.8 |
| 2013-09-17 | 8.2 | 14.0 | 7.6 | 17.7 | 7.1 | 15.6 | 7.9 | 16.7 | 7.2 | 9.1 | 9.1 | 9.4 |
| 2013-09-24 | 8.6 | 12.7 | 7.2 | 19.3 | 7.8 | 17.1 | 8.1 | 18.0 | 7.8 | 9.1 | 9.7 | 9.4 |
| 2013-10-01 | 8.8 | 12.1 | 7.0 | 18.4 | 8.4 | 16.3 | 8.6 | 16.8 | 7.4 | 7.3 | 9.2 | 7.9 |
| 2013-10-08 | 8.5 | 12.2 | 6.7 | 18.9 | 8.5 | 17.2 | 8.4 | 17.1 | 7.4 | 5.9 | 8.1 | 6.6 |
| 2013-10-15 | 7.8 | 12.5 | 6.2 | 18.2 | 7.5 | 17.8 | 7.6 | 17.2 | 7.3 | 5.1 | 7.0 | 6.1 |
| 2013-10-22 | 7.3 | 13.2 | 5.9 | 18.8 | 7.3 | 20.0 | 7.4 | 18.8 | 6.9 | 5.1 | 6.8 | 6.3 |
| 2013-10-29 | 7.3 | 13.9 | 5.7 | 18.1 | 7.8 | 20.1 | 6.9 | 19.1 | 7.6 | 5.1 | 6.7 | 6.3 |
| 2013-11-05 | 7.8 | 13.6 | 5.9 | 18.8 | 8.9 | 21.3 | 7.2 | 20.8 | 8.4 | 5.7 | 7.3 | 6.9 |
| 2013-11-12 | 7.8 | 14.5 | 6.0 | 18.5 | 9.5 | 21.2 | 7.4 | 21.2 | 7.6 | 6.0 | 7.4 | 7.0 |
| 2013-11-19 | 7.6 | 16.2 | 6.1 | 21.9 | 7.7 | 24.7 | 7.3 | 25.6 | 8.3 | 5.9 | 6.6 | 7.0 |
| 2013-11-26 | 7.6 | 17.8 | 5.8 | 23.7 | 7.2 | 26.9 | 7.9 | 28.3 | 8.8 | 6.8 | 6.6 | 7.8 |
| 2013-12-03 | 7.0 | 19.9 | 4.9 | 24.8 | 6.1 | 28.1 | 7.7 | 30.5 | 7.3 | 5.9 | 6.1 | 6.9 |
| 2013-12-10 | 7.3 | 20.2 | 4.5 | 24.3 | 6.1 | 27.8 | 7.9 | 30.9 | 8.3 | 6.2 | 6.9 | 7.0 |
| 2013-12-17 | 7.8 | 18.9 | 4.3 | 22.2 | 8.2 | 24.6 | 7.8 | 28.9 | 8.0 | 6.1 | 8.0 | 6.4 |
| 2013-12-24 | 7.2 | 18.4 | 4.7 | 22.3 | 7.6 | 22.9 | 7.7 | 28.5 | 5.6 | 6.8 | 7.6 | 6.5 |
| 2013-12-31 | 7.5 | 18.1 | 5.7 | 23.0 | 8.1 | 22.0 | 8.1 | 28.3 | 6.3 | 8.0 | 7.6 | 7.1 |
| 2014-01-07 | 7.7 | 16.4 | 5.2 | 20.8 | 7.6 | 18.6 | 7.4 | 25.3 | 4.7 | 8.1 | 6.3 | 7.4 |
| 2014-01-14 | 7.3 | 16.7 | 5.5 | 21.2 | 6.8 | 19.7 | 7.6 | 25.6 | 4.1 | 8.7 | 5.8 | 8.1 |
| 2014-01-21 | 7.9 | 16.3 | 5.2 | 20.1 | 7.0 | 19.4 | 7.6 | 24.3 | 6.4 | 8.1 | 6.6 | 7.7 |
| 2014-01-28 | 7.9 | 15.6 | 6.6 | 20.1 | 6.7 | 20.1 | 8.7 | 24.1 | 7.8 | 6.9 | 7.4 | 6.7 |
| 2014-02-04 | 7.6 | 16.1 | 5.5 | 20.0 | 6.7 | 21.3 | 8.0 | 24.2 | 8.2 | 6.5 | 8.1 | 6.7 |
| 2014-02-11 | 7.3 | 16.4 | 5.0 | 16.9 | 6.1 | 18.0 | 8.0 | 20.7 | 7.8 | 6.5 | 7.6 | 7.3 |
| 2014-02-18 | 7.0 | 15.0 | 4.6 | 16.4 | 6.7 | 17.7 | 7.9 | 20.3 | 6.6 | 7.2 | 7.6 | 8.7 |
| 2014-02-25 | 6.5 | 14.3 | 4.3 | 12.5 | 6.5 | 14.3 | 7.8 | 16.8 | 5.1 | 8.2 | 7.4 | 10.2 |
| 2014-03-04 | 6.3 | 14.1 | 4.0 | 11.8 | 6.7 | 13.3 | 7.2 | 15.0 | 5.0 | 9.1 | 7.4 | 11.6 |
| 2014-03-11 | 6.7 | 12.6 | 4.7 | 14.0 | 7.3 | 16.0 | 7.1 | 16.0 | 5.3 | 9.1 | 8.8 | 11.2 |
| 2014-03-18 | 7.1 | 13.3 | 5.9 | 15.3 | 6.5 | 17.9 | 7.6 | 15.7 | 6.3 | 8.5 | 9.6 | 10.4 |
| 2014-03-25 | 7.7 | 14.3 | 6.8 | 19.7 | 7.4 | 22.1 | 7.8 | 18.0 | 6.6 | 8.4 | 9.6 | 9.7 |
| 2014-04-01 | 8.1 | 15.1 | 8.3 | 21.5 | 7.3 | 24.1 | 8.4 | 18.9 | 7.0 | 8.4 | 9.4 | 8.7 |
| 2014-04-08 | 8.1 | 16.6 | 8.3 | 22.4 | 8.1 | 24.5 | 8.5 | 19.0 | 6.8 | 9.5 | 8.4 | 9.3 |
| 2014-04-15 | 7.8 | 18.2 | 8.5 | 23.7 | 9.0 | 24.9 | 8.4 | 20.3 | 5.8 | 11.1 | 7.1 | 11.0 |
| 2014-04-22 | 7.8 | 18.9 | 8.6 | 24.4 | 8.5 | 25.2 | 8.6 | 21.3 | 5.7 | 11.5 | 7.2 | 12.1 |
| 2014-04-29 | 8.0 | 20.0 | 8.7 | 26.0 | 9.3 | 26.1 | 8.7 | 23.0 | 5.9 | 12.2 | 8.2 | 13.2 |
Source: NRCan
Crude Oil Overview
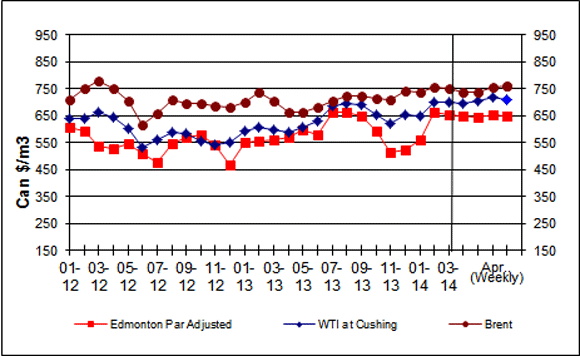
Brent Prices Pushed Upward
For the week ending April 25, 2014, crude oil prices averaged between $650/m3 and $761/m3 ($US$94 to US$110 per barrel).
Edmonton Par and WTI decreased by $5/m3 and $10/m3 (US$1 and US$1.76 per barrel), respectively, compared to the previous week, while Brent prices increased $4/m3 (US$0.24 per barrel). Compared to the same period in 2013, all three benchmarks have increased in the range of $97/m3 to $120/m3 (US$8 to $11 per barrel).
North American crude oil prices fluctuated in a narrow range, while Brent oil prices firmed up on geopolitical tensions between Russia and Ukraine, declining refinery turnarounds and North Sea field maintenance.
U.S. crude oil inventories are well above the average range for this time of the year due to season maintenance for refineries, the opening of the TransCanada pipeline to the U.S. Gulf Coast, and increasing U.S. tight oil production.
Figure 6: Crude Oil Price Comparisons
Text version
Figure 6
This graph shows crude oil prices for Edmonton Par, WTI and Brent. The average weekly prices for the period ending April 25, 2014, were $650/cubic metres, $708/cubic metres and $761/cubic metres for Edmonton Par, WTI and Brent, respectively.
| Date | Edmonton Par Prices | WTI Prices | Brent Prices |
| 01/12 | 608.11 | 639.88 | 709.45 |
| 02/12 | 594.50 | 640.89 | 750.59 |
| 03/12 | 538.60 | 663.34 | 780.71 |
| 04/12 | 528.21 | 644.60 | 751.91 |
| 05/12 | 548.81 | 601.64 | 704.10 |
| 06/12 | 507.78 | 532.76 | 618.43 |
| 07/12 | 477.07 | 560.69 | 659.07 |
| 08/12 | 544.82 | 587.49 | 707.75 |
| 09/12 | 570.15 | 582.08 | 697.56 |
| 10/12 | 578.61 | 555.66 | 694.60 |
| 11/12 | 539.87 | 543.52 | 686.30 |
| 12/12 | 467.14 | 549.56 | 680.33 |
| 01/13 | 549.97 | 592.14 | 699.83 |
| 02/13 | 553.76 | 605.29 | 736.06 |
| 03/13 | 560.66 | 598.93 | 705.36 |
| 04/13 | 571.20 | 590.06 | 663.78 |
| 05/13 | 598.81 | 608.31 | 662.59 |
| 06/13 | 577.25 | 630.51 | 680.52 |
| 07/13 | 664.03 | 685.36 | 703.73 |
| 08/13 | 665.21 | 697.44 | 722.47 |
| 09/13 | 647.06 | 691.84 | 723.16 |
| 10/13 | 592.41 | 655.54 | 713.92 |
| 11/13 | 511.65 | 620.13 | 711.21 |
| 12/13 | 524.69 | 655.42 | 740.65 |
| 01/14 | 561.87 | 651.27 | 735.43 |
| 02/14 | 665.35 | 699.89 | 756.56 |
| 03/14 | 655.67 | 701.90 | 752.47 |
| April 4, 2014 | 651.24 | 696.87 | 736.51 |
| April 11, 2014 | 642.44 | 706.61 | 737.59 |
| April 18, 2014 | 655.24 | 717.45 | 756.60 |
| April 25, 2014 | 650.44 | 707.54 | 760.70 |
Sources: NRCan
| Crude Oil Types | Week Ending: 2014-04-25 |
Change From: Previous Week | Change From: Last Year | |||
|---|---|---|---|---|---|---|
| $Can/ m3 |
$US/ bbl |
$Can/ m3 |
$US/ bbl |
$Can/ m3 |
$US/ bbl |
|
| Edmonton Par | 650.44 | 93.76 | -4.80 | -1.00 | +97.27 | +7.79 |
| WTI | 707.54 | 101.99 | -9.92 | -1.76 | +120.10 | +10.70 |
| Brent | 760.70 | 109.65 | +4.10 | +0.24 | +105.60 | +7.85 |
Source: NRCan
Canada’s Proven Oil Reserves
Canada's proven oil reserves are sufficient to meet demand for around 140 years at current rates of production. Proven oil reserves (also called proved reserves, established reserves, or simply reserves) are defined as the amount of oil that can be recovered from known reservoirs under current technology and present economic conditions. Oil reserves are specifically proven by drilling, testing or production. Undiscovered resources are estimates of oil volumes in the subsurface which are thought to exist, based on geological information, but have yet to be proven as reserves by drilling, testing and production.
Canada's oil reserves consist of oil contained in the oil sands deposits of Alberta and in other non-oil sands deposits. Most of Canada's oil reserves – both oil sands and non-oil sands – are found in the Western Canadian Sedimentary Basin, which underlies parts of British Columbia, Alberta, Saskatchewan, Manitoba and the Northwest Territories.
Total Canadian proven oil reserves are estimated at 27.5 billion m3 (173 billion barrels), of which 26.1 billion m3 (168 billion barrels) are found in Alberta's oil sands and an additional 0.8 billion m3 (5 billion barrels) in conventional, offshore and tight oil formations. East coast offshore conventional oil reserves are currently estimated at 0.2 billion m3 (1.5 billion barrels), while Alberta's conventional and tight oil reserves are estimated at 0.3 billion m3 (1.7 billion barrels).
Source: Natural Resources CanadaSupplement
Changing North American Crude Oil Price Dynamics
For both Canada and the U.S., refinery oil demand is met by a combination of domestic production and imports. Canada is a net oil exporter, and the U.S. a net oil importer. For many years, Canadian crude oil – both light crude and heavy crude – has been exported to the U.S. midcontinent, almost entirely by pipeline. Both Canada and the U.S. import crude from outside North America by tanker at receiving terminals and refineries along the Canadian and U.S. east coasts, and in the U.S. Gulf Coast.
Crude oil of various reference grades is sold in various reference markets. These prices always have both oil quality and geographic components. Light oil is worth more than heavy oil, and any oil is worth more in an area of high oil demand than it is worth in an area of high oil supply. In this article, we will refer to the following reference oil markers: i) Edmonton Par – the price of light crude oil at Edmonton, Alberta; ii) West Texas Intermediate (WTI) – the price of light crude oil at Cushing, Oklahoma; and, iii) Brent – the price of light crude oil at the Sullom Voe marine terminal, UK.
Situation Prior to 2011 - Until recently, crude oil supply to the Cushing, Oklahoma area was insufficient to satisfy Cushing area oil demand. To meet Cushing demand, light oil was imported by tanker to the U.S. Gulf Coast, and flowed northward by pipeline to Cushing. Cushing is the price settlement point for the WTI NYMEX futures contract, the benchmark light crude oil price for the U.S. Until recently, the marginal supply for the Cushing market was light crude oil imported by tanker to the Gulf Coast, and moved north by pipeline. The cost of the marginal supply was equal to the Brent oil price plus transportation costs by tanker and pipeline to Cushing, or “Brent plus”.
Edmonton Par prices prior to 2011 were typically about equal to Brent prices. This reflected the fact that, to penetrate into the Cushing market, Canadian suppliers who delivered oil to Cushing received the WTI price. However, to access the Cushing market meant paying pipeline tolls to move oil from Edmonton to Cushing. Thus, Canadian producer light oil sale revenues, “netted back to Edmonton” were “WTI minus”.
New Oil Flow Patterns - The North American oil supply picture has changed significantly over the past decade. The surge in unconventional oil production (oil sands in Canada and tight light oil in the U.S.) has flooded the Cushing market with new supply. Due to inadequate pipeline capacity to bring this oil to other markets, there has been an increase in oil shipments by rail, to Gulf coast and east coast refiners, as well as to Cushing. With Cushing being oversupplied by continental U.S. and Canadian crude oil production, flows of Brent type crudes from the Gulf Coast north to Cushing by pipeline are no longer necessary. Cushing has become more of a supply point (oil flows out of Cushing), whereas before it was mainly a market point (oil flowed in to Cushing).
This reflects the new dynamic of an oversupplied continental Canada/U.S. oil market which is seeking to deliver excess crude oil to tidewater. Now, as a supply point, the price of oil at Cushing is now driven by the price of oil at the nearest market point, less the cost to ship oil to that point. Thus, the Cushing price is no longer “Brent plus” but is “Brent minus”. Cushing has gone from a location which receives oil, to a location which ships out oil. In 2013, WTI prices averaged $97.99/bbl and Brent averaged $108.72/bbl.
Edmonton Par continues to be WTI minus. However, because WTI is no longer Brent plus but is Brent minus, this also means that Edmonton Par prices are typically lower than Brent prices. In 2013, Edmonton Par prices averaged $90.23 - $18.49 per barrel lower than Brent. The oversupplied North American oil market has resulted in new oil pricing dynamics. The WTI price now trades at a discount to the Brent price. Edmonton Par trades at a discount to WTI – it typically did for many years – but now Edmonton Par is also lower than Brent.
Relationship of Crude Prices to Transportation Costs - WTI and Edmonton Par prices can be expected to trend towards Brent prices less the transportation costs to tidewater. Since pipeline tolls from Edmonton to tidewater in Burnaby, British Columbia and from Cushing to the U.S. Gulf Coast are in the $3 per barrel range, so long as pipeline capacity at this price is available, one could expect Edmonton Par and WTI prices to be close to Brent prices. However, in 2013, Edmonton Par and WTI prices were $18.49 and $10.73 per barrel lower than Brent, respectively. This was due to insufficient pipeline capacity from Edmonton to tidewater, and from Cushing to tidewater. As a result, shippers are forced to use more expensive rail transport to move oil from these locations to tidewater. This means the prices of Edmonton Par and WTI have been steeply discounted versus Brent. As pipeline capacity is added, these discounts can be expected to narrow. Our analysis has reached similar conclusions as a recent article published by Dr. Andrew Leach of the University of Alberta. Dr. Leach also observed the shift in crude oil flows and concluded that even as transportation obstacles are addressed, the dynamic of increasing North American oil production and subsequent discounts for midcontinent crudes to Brent will remain.
Conclusions - Flows of imported light crude, delivered to North America by tanker, are becoming less and less necessary. Oil is expected to continue to flow from Cushing to tidewater, replacing imported oil in the Gulf Coast market. North American crudes are replacing imports at refinery markets along the U.S. and Canadian east coast as well, and this trend is expected to continue. These flow dynamics – North America evolving from a large oil importer towards being self-sufficient or even potentially a net exporter - mean that North American crude oil prices are likely to remain somewhat lower than global prices for crudes of similar quality. This is expected to be the case even if construction of additional pipeline or rail capacity to tidewater is achieved.
Source: Natural Resources Canada, Petroleum Resources BranchDownload the report
Fuel Focus - Printable Version [PDF, 460 KB]
To read Adobe Acrobat® files, you will need to download and install the free Acrobat Reader® software available from Adobe Systems Incorporated.
Page details
- Date modified: