
Fuel Focus, July 22, 2016
Table of Contents
- National Overview
- Recent Developments
- Retail Gasoline Overview
- Wholesale Gasoline Prices
- Gasoline Refining and Marketing Margins
- Crude Oil Overview
- Download the report
National Overview
Canadian Retail Gasoline Prices Decreased by 4 cents over the Last Two Weeks
For the two-week period ending July 19, 2016, the Canadian average retail gasoline price was $1.03 per litre. This is a decrease of 4 cents over the two-week period ending July 5, 2016. Prices are 20 cents per litre lower than the same period last year.
Average retail diesel prices decreased by 1 cent per litre to $1.00 per litre compared to the two-week period ending July 5, 2016. This is 11 cents less compared to the same period last year. Over the same period, furnace oil prices remained at $0.98, 8 cents per litre less than a year ago.
Figure 1: Crude Oil and Regular Gasoline Price Comparison
(National Average)
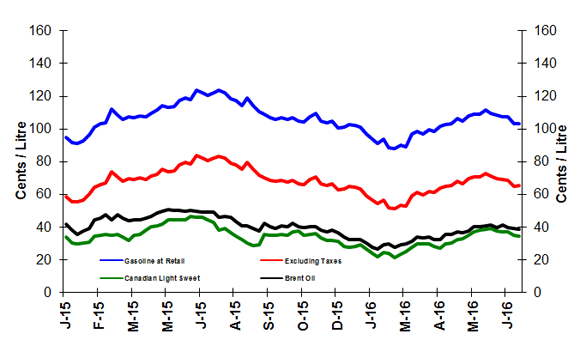
Text version
Figure 1
The graph shows prices in cents per litre for gasoline at retail, gasoline excluding taxes, and Canadian Light Sweet and Brent crude oil prices. Gasoline prices ended the period of July 19, 2016 at 103.5 cents per litre, excluding taxes at 65.4 cents per litre, Canadian Light Sweet at 34.3 cents per litre and Brent at 38.6 cents per litre.
| Dates | Gasoline at retail | Excluding Taxes | Canadian Light Sweet | Brent crude |
|---|---|---|---|---|
| 06/01/2015 | 95.0 | 58.8 | 33.8 | 42.0 |
| 13/01/2015 | 91.5 | 55.7 | 30.5 | 38.1 |
| 20/01/2015 | 91.3 | 55.4 | 29.8 | 35.8 |
| 27/01/2015 | 92.5 | 56.5 | 30.3 | 37.6 |
| 03/02/2015 | 96.5 | 60.2 | 30.7 | 39.1 |
| 10/02/2015 | 101.2 | 64.5 | 34.7 | 44.2 |
| 17/02/2015 | 103.0 | 66.2 | 35.0 | 45.3 |
| 24/02/2015 | 103.7 | 66.8 | 35.7 | 47.7 |
| 03/03/2015 | 112.3 | 74.1 | 35.1 | 44.6 |
| 10/03/2015 | 108.6 | 70.6 | 35.4 | 47.4 |
| 17/03/2015 | 105.8 | 68.0 | 33.8 | 45.4 |
| 2015-03-24 | 107.3 | 69.5 | 31.6 | 43.7 |
| 2015-03-31 | 107.1 | 69.3 | 34.9 | 44.6 |
| 2015-04-07 | 108.1 | 70.2 | 35.6 | 44.2 |
| 2015-04-14 | 107.6 | 69.1 | 38.1 | 45.3 |
| 2015-04-21 | 109.70 | 72.8 | 40.5 | 46.8 |
| 2015-04-28 | 111.40 | 71.0 | 40.7 | 48.9 |
| 2015-05-05 | 114.5 | 75.3 | 41.8 | 49.9 |
| 2015-05-12 | 113.0 | 74.0 | 44.3 | 50.5 |
| 2015-05-19 | 113.6 | 74.6 | 44.5 | 50.1 |
| 2015-05-26 | 117.4 | 78.0 | 44.5 | 50.2 |
| 2015-06-02 | 119.0 | 79.4 | 44.6 | 49.8 |
| 2015-06-09 | 118.2 | 78.7 | 46.3 | 50.1 |
| 2015-06-16 | 123.6 | 83.7 | 46.0 | 50.0 |
| 2015-06-23 | 122.1 | 82.3 | 45.9 | 49.2 |
| 2015-06-30 | 120.6 | 80.9 | 44.4 | 49.4 |
| 2015-07-07 | 122.1 | 82.2 | 42.8 | 49.0 |
| 2015-07-14 | 123.5 | 83.5 | 38.1 | 46.0 |
| 2015-07-21 | 122.2 | 82.3 | 39.1 | 46.6 |
| 2015-07-28 | 118.4 | 78.9 | 36.5 | 45.8 |
| 2015-08-04 | 117.6 | 78.1 | 34.6 | 43.4 |
| 2015-08-11 | 114.5 | 75.5 | 30.3 | 40.7 |
| 2015-08-18 | 118.8 | 79.5 | 28.8 | 39.0 |
| 2015-08-25 | 114.1 | 75.3 | 29.0 | 37.8 |
| 2015-09-01 | 110.6 | 72.0 | 35.6 | 42.5 |
| 2015-09-08 | 108.9 | 70.4 | 35.1 | 40.4 |
| 2015-09-15 | 107.1 | 68.7 | 35.2 | 39.3 |
| 2015-09-22 | 106.1 | 67.9 | 35.2 | 39.3 |
| 2015-09-29 | 106.8 | 68.6 | 35.5 | 40.6 |
| 2015-10-06 | 105.7 | 67.6 | 35.2 | 40.2 |
| 2015-10-13 | 106.7 | 68.5 | 36.9 | 42.3 |
| 2015-10-20 | 104.6 | 66.7 | 37.8 | 40.0 |
| 2015-10-27 | 104.1 | 66.1 | 34.8 | 39.7 |
| 2015-11-03 | 107.2 | 68.9 | 35.4 | 40.1 |
| 2015-11-10 | 109.4 | 70.9 | 36.1 | 40.3 |
| 2015-11-17 | 104.8 | 66.7 | 33.6 | 38.1 |
| 2015-11-24 | 103.6 | 65.6 | 32.1 | 37.1 |
| 2015-12-01 | 104.7 | 66.5 | 31.9 | 38.1 |
| 2015-12-08 | 100.7 | 62.9 | 31.2 | 36.7 |
| 2015-12-15 | 101.3 | 63.5 | 28.3 | 34.0 |
| 2015-12-22 | 102.7 | 64.9 | 27.7 | 32.6 |
| 2015-12-29 | 102.1 | 64.3 | 28.4 | 32.3 |
| 2016-01-05 | 101.3 | 63.4 | 29.1 | 32.3 |
| 2016-01-12 | 96.8 | 59.4 | 26.6 | 30.5 |
| 2016-01-19 | 93.7 | 56.5 | 23.9 | 27.5 |
| 2016-01-26 | 91.3 | 54.3 | 22.1 | 26.5 |
| 2016-02-02 | 93.8 | 56.5 | 24.4 | 29.1 |
| 2016-02-09 | 88.6 | 51.8 | 23.7 | 29.8 |
| 2016-02-16 | 88.2 | 51.5 | 21.4 | 27.5 |
| 2016-02-23 | 90.1 | 53.4 | 23.2 | 29.0 |
| 2016-03-01 | 89.3 | 52.6 | 25.2 | 29.7 |
| 2016-03-08 | 96.8 | 59.4 | 27.7 | 31.3 |
| 2016-03-15 | 98.6 | 61.2 | 29.8 | 33.8 |
| 2016-03-22 | 96.9 | 59.6 | 29.8 | 33.4 |
| 2016-03-29 | 99.4 | 61.8 | 29.8 | 34.0 |
| 2016-04-05 | 98.7 | 61.2 | 28.3 | 32.4 |
| 2016-04-12 | 101.9 | 64.1 | 27.1 | 32.4 |
| 2016-04-19 | 102.8 | 64.8 | 29.8 | 35.3 |
| 2016-04-26 | 103.3 | 65.3 | 30.2 | 35.5 |
| 2016-05-03 | 106.6 | 68.3 | 32.6 | 37.1 |
| 2016-05-10 | 104.7 | 66.5 | 33.1 | 36.4 |
| 2016-05-17 | 107.8 | 69.5 | 34.8 | 37.8 |
| 2016-05-24 | 109.1 | 70.6 | 37.3 | 40.0 |
| 2016-05-31 | 108.9 | 70.5 | 38.3 | 40.4 |
| 2016-06-07 | 111.4 | 72.6 | 38.9 | 40.9 |
| 2016-06-14 | 109.7 | 71.1 | 39.0 | 41.3 |
| 2016-06-21 | 108.3 | 69.8 | 37.5 | 39.8 |
| 2016-06-28 | 107.5 | 69.0 | 37.0 | 41.3 |
| 2016-07-05 | 107.4 | 68.8 | 36.9 | 39.8 |
| 2016-07-12 | 103.1 | 65.0 | 34.8 | 39.2 |
| 2016-07-19 | 103.5 | 65.4 | 34.3 | 38.6 |
Figure 2: Weekly Regular Gasoline Prices
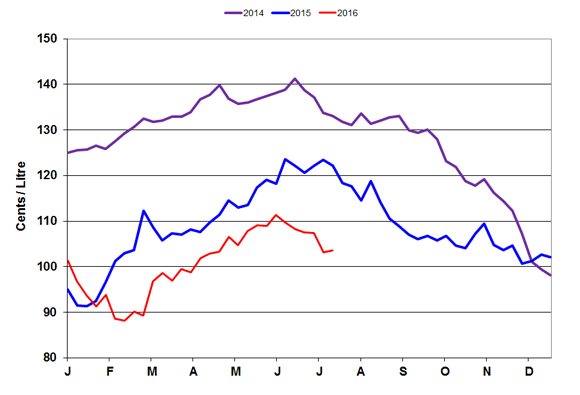
Text version
Figure 2
This graph shows the gasoline price trends from 2014 to 2016.
| Date | 2014 Gasoline at Retail | Date | 2015 Gasoline at Retail | Date | 2016 Gasoline at Retail |
|---|---|---|---|---|---|
| 14-01-07 | 125.00 | 15-01-06 | 95.00 | 16-01-05 | 101.30 |
| 14-01-14 | 125.60 | 15-01-13 | 91.50 | 16-01-12 | 96.80 |
| 14-01-21 | 125.70 | 15-01-20 | 91.30 | 16-01-19 | 93.70 |
| 14-01-28 | 126.60 | 15-01-27 | 92.50 | 16-01-26 | 91.30 |
| 14-02-04 | 125.90 | 15-02-03 | 96.50 | 16-02-02 | 93.80 |
| 14-02-11 | 127.60 | 15-02-10 | 101.20 | 16-02-09 | 88.60 |
| 14-02-18 | 129.30 | 15-02-17 | 103.00 | 16-02-16 | 88.20 |
| 14-02-25 | 130.70 | 15-02-24 | 103.70 | 16-02-23 | 90.10 |
| 14-03-04 | 132.50 | 15-03-03 | 112.30 | 16-03-01 | 89.30 |
| 14-03-11 | 131.80 | 15-03-10 | 108.60 | 16-03-08 | 96.80 |
| 14-03-18 | 132.00 | 15-03-17 | 105.80 | 16-03-15 | 98.60 |
| 14-03-25 | 132.90 | 15-03-24 | 107.30 | 16-03-22 | 96.90 |
| 14-04-01 | 132.90 | 15-03-31 | 107.10 | 16-03-29 | 99.40 |
| 14-04-08 | 133.90 | 15-04-07 | 108.10 | 16-04-05 | 98.70 |
| 14-04-15 | 136.80 | 15-04-14 | 107.60 | 16-04-12 | 101.90 |
| 14-04-22 | 137.70 | 15-04-21 | 109.70 | 16-04-19 | 102.80 |
| 14-04-29 | 139.80 | 15-04-28 | 111.40 | 16-04-26 | 103.30 |
| 14-05-06 | 136.90 | 15-05-05 | 114.50 | 16-05-03 | 106.60 |
| 14-05-13 | 135.70 | 15-05-12 | 113.00 | 16-05-10 | 104.70 |
| 14-05-20 | 136.00 | 15-05-19 | 113.60 | 16-05-17 | 107.80 |
| 14-05-27 | 136.80 | 15-05-26 | 117.40 | 16-05-24 | 109.10 |
| 14-06-03 | 137.40 | 15-06-02 | 119.00 | 16-05-31 | 108.90 |
| 14-06-10 | 138.10 | 15-06-09 | 118.20 | 16-06-07 | 111.40 |
| 14-06-17 | 138.80 | 15-06-16 | 123.60 | 16-06-14 | 109.70 |
| 14-06-24 | 141.20 | 15-06-23 | 122.10 | 16-06-21 | 108.30 |
| 14-07-01 | 138.70 | 15-06-30 | 120.60 | 16-06-28 | 107.50 |
| 14-07-08 | 137.20 | 15-07-07 | 122.10 | 16-07-05 | 107.40 |
| 14-07-15 | 133.80 | 15-07-14 | 123.50 | 16-07-12 | 103.10 |
| 14-07-22 | 133.00 | 15-07-21 | 122.20 | 16-07-19 | 103.50 |
| 14-07-29 | 131.80 | 15-07-28 | 118.40 | 16-07-26 | |
| 14-08-05 | 131.10 | 15-08-04 | 117.60 | 16-08-02 | |
| 14-08-12 | 133.60 | 15-08-11 | 114.50 | 16-08-09 | |
| 14-08-19 | 131.30 | 15-08-18 | 118.80 | 16-08-16 | |
| 14-08-26 | 132.10 | 15-08-25 | 114.10 | 16-08-23 | |
| 14-09-02 | 132.80 | 15-09-01 | 110.60 | 16-08-30 | |
| 14-09-09 | 133.00 | 15-09-08 | 108.90 | 16-09-06 | |
| 14-09-16 | 129.90 | 15-09-15 | 107.10 | 16-09-13 | |
| 14-09-23 | 129.40 | 15-09-22 | 106.10 | 16-09-20 | |
| 14-09-30 | 130.10 | 15-09-29 | 106.80 | 16-09-27 | |
| 14-10-07 | 128.00 | 15-10-06 | 105.70 | 16-10-04 | |
| 14-10-14 | 123.10 | 15-10-13 | 106.70 | 16-10-11 | |
| 14-10-21 | 121.90 | 15-10-20 | 104.60 | 16-10-18 | |
| 14-10-28 | 118.80 | 15-10-27 | 104.10 | 16-10-25 | |
| 14-11-04 | 117.80 | 15-11-03 | 107.20 | 16-11-01 | |
| 14-11-11 | 119.20 | 15-11-10 | 109.40 | 16-11-08 | |
| 14-11-18 | 116.20 | 15-11-17 | 104.80 | 16-11-15 | |
| 14-11-25 | 114.40 | 15-11-24 | 103.60 | 16-11-22 | |
| 14-12-02 | 112.30 | 15-12-01 | 104.70 | 16-11-29 | |
| 14-12-09 | 107.20 | 15-12-08 | 100.70 | 16-12-06 | |
| 14-12-16 | 101.10 | 15-12-15 | 101.30 | 16-12-13 | |
| 14-12-23 | 99.40 | 15-12-22 | 102.70 | 16-12-20 | |
| 14-12-30 | 98.10 | 15-12-29 | 102.10 | 16-12-27 |
| ¢/L | Two week average ending: 2016-07-19 | Change from: 2 weeks ago | Change from: Last Year |
|---|---|---|---|
| Gasoline | 103.3 | -4.2 | -19.6 |
| Diesel | 100.1 | -1.4 | -10.5 |
| Furnace Oil | 97.8 | -0.3 | -7.8 |
| Natural Gas Prices in $CA/GJ | |||
| Alberta (NGX) | 2.17 | -0.03 | -0.56 |
| Ontario (Dawn) | 3.35 | -0.02 | -0.18 |
Source: NRCan, Bloomberg
| 2016-07-19 | ¢/kilogram | ¢/L gasoline equivalent | ¢/L diesel equivalent |
|---|---|---|---|
| Vancouver | 123.9 | 81.7 | 84.7 |
| Edmonton | 115.0 | 75.9 | 78.7 |
| Toronto | 128.4 | 84.7 | 87.8 |
Source: ¢/kg Kent Marketing Services Limited
Recent Developments
- International Energy Agency (IEA) July Oil Market Report
On July 13, 2016, the IEA released its July 2016 Monthly Oil Market Report. The report notes that global demand in the second quarter of this year increased by 1.4 million barrels per day (bpd) compared to last year, driven largely by strong European demand. The IEA expects this to continue through the year. With respect to supply, they note that global oil production rose by 0.6 million bpd in June to 96 million bpd recovering from events in May that affected both OPEC and non-OPEC output, including the wildfires in Alberta and production disruptions in Nigeria. Global production was down 750,000 bpd from last year as higher OPEC output was offset by non-OPEC declines.
- Canadian Motor Gasoline and Diesel Sales up in April
On July 14, 2016, Statistics Canada released the supply and disposition of refined petroleum products figures for April 2016. Canadian petroleum product sales reached 8.3 billion litres in April 2016 and were up by 2% compared to April 2015. Motor gasoline sales reached 3.7 billion litres and were up 6% compared to April of last year, while diesel sales were up 8% compared to last year and reached 2.4 billion litres.
- Oil Sands Advisory Group Established in Alberta
On July 13, 2016, the Government of Alberta announced the establishment of an Oil Sands Advisory Group (OSAG) to advise the provincial government on aspects of the province’s Climate Leadership Plan related to the oil sands. The OSAG includes members of industry, environmental organizations, members from Indigenous communities and the general public. The group’s main tasks will be to consider how to implement the 100-megatonne per year carbon emissions limit for the oil sands industry, develop structures and processes to address local and regional environmental issues, and provide advice to the government on investing carbon price revenue in innovations to reduce future emissions intensity.
Retail Gasoline Overview
For the period ending July 19, 2016, the four-week-average regular gasoline pump price in selected cities across Canada decreased by 3 cents to $1.05 per litre compared to the previous report of July 8, 2016. Compared to the same period in 2015, the average Canadian pump price is 17 cents per litre lower.
The four-week-average crude oil component decreased by 2 cents to reach an average of 37 cents over the period. The crude oil price component of gasoline is 6 cents per litre lower than this time last year.
Retail gasoline prices in Western centres decreased by 6 cents per litre compared to the previous report and ranged from $0.95 per litre to $1.24 per litre. Prices in Eastern cities decreased by 6 cents per litre and ranged from $0.98 to $1.23 per litre.
At the national level, refining and marketing costs and margins were 30 cents per litre, one cent per litre less than in the previous report and 9 cents per litre lower than this time last year.
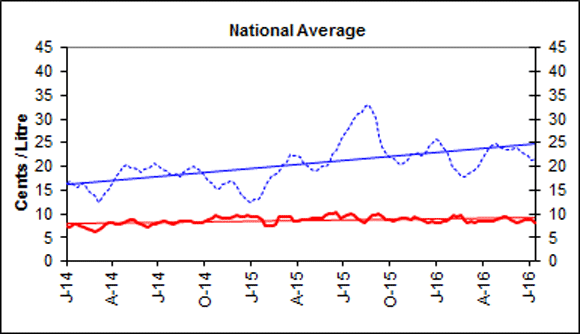
Figure 3: Regular Gasoline Pump Prices in Selected Cities Four-Week Average (June 28 to July 19, 2016)
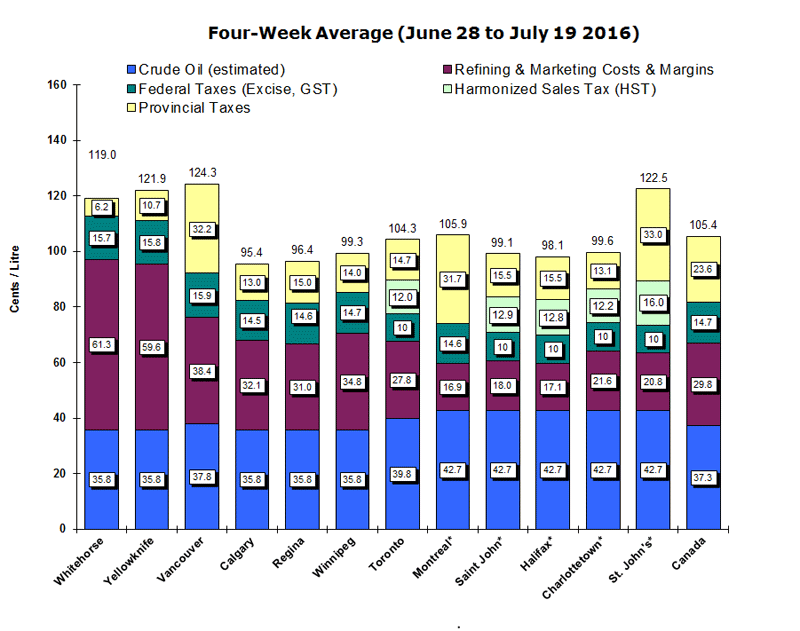
Text version
Figure 3
This graph shows the gasoline price components for 2 territories and 10 cities plus the national average.
Note that effective this report, transportation costs are included in the crude oil estimate for Vancouver (2 cents), Toronto (4 cents) and Eastern Canada (3 cents)
| Whitehorse | Yellowknife | Vancouver | Calgary | Regina | Winnipeg | Toronto | Montreal* | Saint John* | Halifax* | Charlottetown* | St. John's* | Canada | |
|---|---|---|---|---|---|---|---|---|---|---|---|---|---|
| Pump Price | 119.0 | 121.9 | 124.3 | 95.4 | 96.4 | 99.3 | 104.3 | 105.9 | 99.1 | 98.1 | 99.6 | 122.5 | 105.4 |
| Crude (est.) | 35.8 | 35.8 | 37.8 | 35.8 | 35.8 | 35.8 | 39.8 | 42.7 | 42.7 | 42.7 | 42.7 | 42.7 | 37.3 |
| Federal Taxes | 15.7 | 15.8 | 15.9 | 14.5 | 14.6 | 14.7 | 10.0 | 14.6 | 10.0 | 10.0 | 10.0 | 10.0 | 14.7 |
| Provincial Tax | 6.2 | 10.7 | 32.2 | 13.0 | 15.0 | 14.0 | 14.7 | 31.7 | 15.5 | 15.5 | 13.1 | 33.0 | 23.6 |
| HST | 12.0 | 12.9 | 12.8 | 12.2 | 16.0 | ||||||||
| Refining & Marketing Costs & Margins | 61.3 | 59.6 | 38.4 | 32.1 | 31.0 | 34.8 | 27.8 | 16.9 | 18.0 | 17.1 | 21.6 | 20.8 | 29.8 |
Source: NRCan
* Regulated Markets
An estimate of crude oil transportation costs is included in the crude oil estimate for Vancouver (2 cents per litre), Toronto, (4 cents per litre), and Atlantic Canada and Quebec (3 cents per litre)
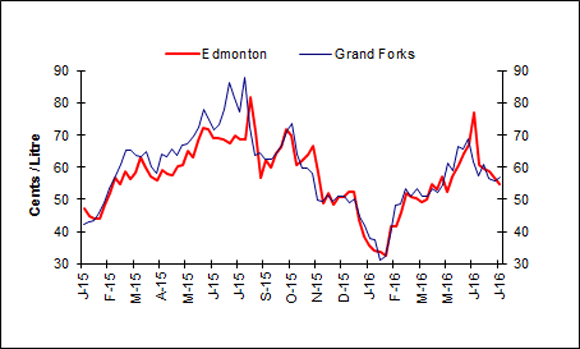
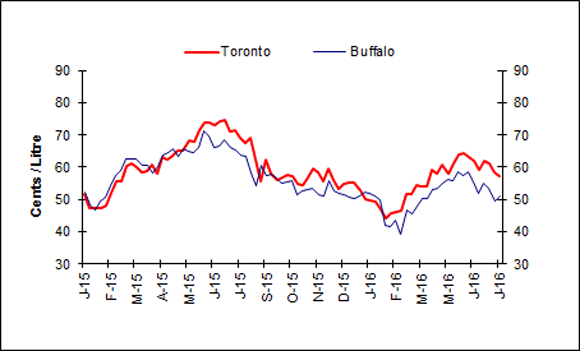
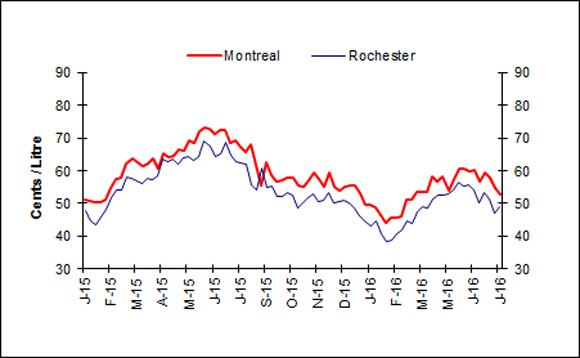
Wholesale Gasoline Prices
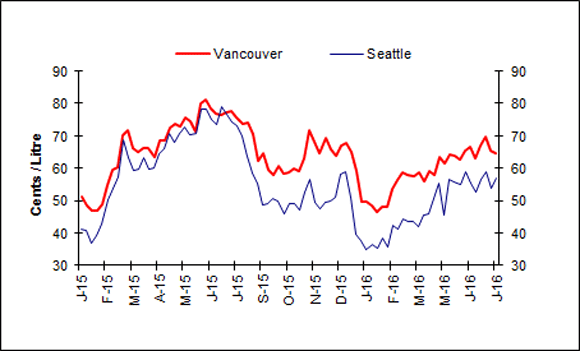
Over the two-week period ending July 14, 2016, wholesale gasoline prices came down in the selected Canadian cities, while in the U.S. cities they increased slightly over the last week.
Wholesale gasoline prices for the two-week period ended between 47 and 65 cents per litre. This compares to the previous two-week period where prices were in the 51 and 69 cents per litre range.
In Western cities, wholesale gasoline prices ranged between a decrease of 5 cents per litre to an increase of less than 1 cent per litre, ending in the 55 to 65 cents per litre range.
Wholesale gasoline prices in Eastern markets of Canada and the U.S. decreased between 3 and 5 cents per litre and ended in the 50 to 57 cents per litre range.
Wholesale prices remain lower than last year in all these markets.
 |
 |
|
 |
 |
|
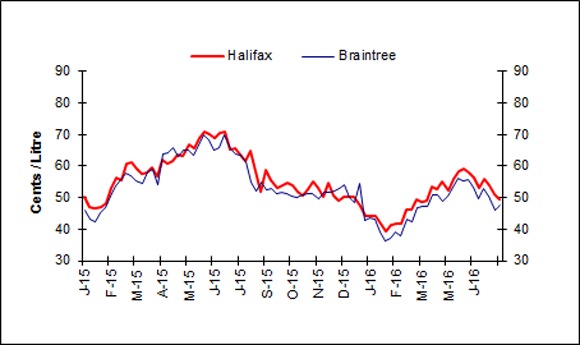 |
Text version
Figure 4
This graph shows the trend in wholesale gasoline prices for selected centres in Canada and the U.S.
| DATE | Halifax | Braintree | Montreal | Rochester | Toronto | Buffalo | Edmonton | Grand Forks | Vancouver | Seattle |
|---|---|---|---|---|---|---|---|---|---|---|
| Thu 01-Jan-15 | 50.20 | 45.88 | 51.30 | 47.82 | 51.70 | 52.04 | 47.20 | 42.25 | 51.20 | 41.16 |
| Thu 08-Jan-15 | 46.90 | 43.19 | 50.60 | 44.81 | 47.30 | 48.09 | 45.00 | 42.87 | 48.50 | 40.72 |
| Thu 15-Jan-15 | 46.60 | 42.30 | 50.30 | 43.50 | 47.20 | 46.68 | 44.20 | 43.28 | 47.00 | 37.04 |
| Thu 22-Jan-15 | 47.20 | 45.26 | 50.50 | 45.67 | 47.20 | 49.64 | 43.90 | 45.92 | 47.00 | 39.15 |
| Thu 29-Jan-15 | 48.20 | 47.00 | 51.00 | 48.37 | 48.00 | 50.44 | 48.40 | 48.80 | 48.80 | 42.85 |
| Thu 05-Feb-15 | 52.90 | 50.65 | 54.60 | 51.75 | 52.20 | 54.13 | 52.10 | 53.44 | 54.60 | 50.12 |
| Thu 12-Feb-15 | 56.20 | 53.56 | 57.40 | 54.19 | 55.40 | 57.51 | 56.70 | 56.48 | 59.40 | 53.76 |
| Thu 19-Feb-15 | 55.60 | 55.91 | 57.70 | 54.23 | 55.40 | 58.78 | 54.70 | 60.87 | 60.40 | 57.33 |
| Thu 26-Feb-15 | 60.80 | 57.71 | 62.30 | 58.17 | 60.20 | 62.69 | 58.60 | 65.23 | 70.30 | 68.96 |
| Thu 05-Mar-15 | 61.20 | 56.75 | 63.80 | 57.62 | 61.20 | 62.49 | 56.30 | 65.32 | 71.60 | 63.08 |
| Thu 12-Mar-15 | 59.30 | 55.45 | 62.70 | 56.74 | 59.80 | 62.36 | 58.20 | 63.71 | 66.40 | 59.34 |
| Thu 19-Mar-15 | 57.90 | 54.71 | 61.40 | 55.89 | 58.30 | 60.60 | 63.00 | 63.29 | 65.20 | 59.76 |
| Thu 26-Mar-15 | 58.10 | 58.24 | 62.00 | 57.84 | 58.90 | 60.60 | 60.10 | 64.71 | 66.30 | 63.29 |
| Thu 02-Apr-15 | 59.60 | 58.97 | 63.70 | 57.44 | 60.80 | 58.31 | 57.10 | 59.91 | 66.20 | 59.80 |
| Thu 09-Apr-15 | 59.60 | 54.12 | 60.70 | 58.63 | 57.80 | 60.01 | 55.90 | 58.28 | 63.30 | 59.94 |
| Thu 16-Apr-15 | 62.10 | 63.74 | 65.30 | 63.38 | 63.10 | 63.81 | 59.20 | 63.94 | 68.60 | 64.41 |
| Thu 23-Apr-15 | 60.70 | 64.33 | 64.20 | 62.59 | 62.20 | 64.43 | 57.80 | 63.33 | 68.60 | 66.20 |
| Thu 30 Apr-15 | 61.70 | 65.85 | 64.70 | 63.49 | 63.50 | 65.56 | 57.40 | 65.51 | 72.60 | 70.92 |
| Thu 7 May-15 | 63.50 | 63.07 | 66.60 | 61.79 | 65.20 | 63.39 | 60.20 | 63.71 | 73.80 | 67.87 |
| Thu 14 May-15 | 63.30 | 65.00 | 66.20 | 64.04 | 65.20 | 65.64 | 60.70 | 66.92 | 72.90 | 70.76 |
| Thu 21-May-15 | 66.80 | 64.92 | 69.10 | 64.28 | 68.40 | 64.92 | 65.00 | 67.13 | 75.70 | 72.83 |
| Thu 28-May-15 | 65.70 | 63.55 | 68.50 | 63.23 | 67.90 | 64.52 | 62.90 | 69.68 | 74.60 | 70.32 |
| Thu 04-Jun-15 | 69.00 | 66.58 | 71.90 | 64.27 | 71.40 | 66.25 | 68.20 | 72.51 | 71.20 | 70.54 |
| Thu 11-Jun-15 | 71.00 | 69.89 | 73.30 | 69.08 | 73.70 | 71.22 | 72.40 | 78.00 | 79.90 | 78.13 |
| Thu 18-Jun-15 | 70.30 | 68.14 | 72.70 | 67.49 | 73.80 | 69.44 | 71.70 | 74.98 | 81.20 | 78.24 |
| Thu 25-Jun-15 | 68.90 | 65.15 | 71.20 | 64.18 | 72.90 | 66.12 | 69.00 | 71.60 | 78.60 | 75.15 |
| Thu 02-Jul-15 | 70.50 | 65.89 | 72.40 | 65.23 | 74.20 | 66.54 | 68.90 | 73.39 | 76.80 | 73.39 |
| Thu 9-Jul-15 | 72.30 | 69.94 | 73.70 | 68.60 | 74.60 | 68.26 | 68.70 | 78.01 | 76.60 | 79.02 |
| Thu 16-Jul-15 | 65.40 | 65.29 | 68.50 | 64.60 | 71.10 | 65.97 | 67.40 | 86.48 | 77.10 | 76.57 |
| Thu 23-Jul-15 | 65.80 | 64.02 | 69.30 | 62.65 | 71.50 | 65.40 | 69.90 | 81.58 | 77.60 | 74.35 |
| Thu 30-Jul-15 | 63.80 | 63.32 | 67.20 | 62.28 | 69.20 | 63.66 | 68.50 | 77.08 | 75.60 | 72.95 |
| Thu 06-Aug-15 | 61.80 | 58.98 | 65.60 | 59.33 | 67.40 | 61.06 | 68.60 | 75.98 | 73.50 | 65.57 |
| Thu 13-Aug-15 | 64.90 | 61.15 | 68.10 | 61.84 | 69.10 | 62.88 | 81.80 | 87.41 | 74.20 | 69.79 |
| Thu 20-Aug-15 | 58.20 | 54.94 | 61.90 | 55.63 | 62.50 | 58.05 | 71.10 | 72.56 | 70.60 | 63.58 |
| Thu 27-Aug-15 | 51.80 | 52.64 | 55.30 | 54.73 | 55.50 | 54.73 | 56.70 | 64.15 | 62.30 | 58.92 |
| Thu 03-Sep-15 | 58.60 | 55.09 | 62.50 | 60.67 | 62.30 | 60.67 | 62.20 | 64.51 | 64.80 | 55.44 |
| Thu 10-Sep-15 | 55.40 | 52.73 | 58.70 | 55.18 | 58.00 | 57.62 | 59.80 | 62.51 | 59.50 | 48.89 |
| Thu 17-Sep-15 | 53.30 | 51.21 | 56.70 | 52.25 | 56.10 | 56.43 | 64.20 | 64.44 | 58.00 | 50.51 |
| Thu 24-Sep-15 | 54.10 | 51.85 | 57.10 | 52.20 | 56.70 | 55.02 | 66.20 | 67.01 | 60.50 | 49.73 |
| Thu 01-Oct-15 | 54.70 | 51.42 | 57.80 | 53.17 | 57.50 | 55.27 | 71.80 | 71.36 | 58.20 | 45.83 |
| Thu 08-Oct-15 | 54.00 | 50.55 | 58.00 | 52.62 | 57.10 | 55.71 | 69.90 | 73.59 | 58.80 | 49.18 |
| Thu 15-Oct-15 | 52.00 | 50.11 | 55.50 | 48.75 | 54.60 | 51.47 | 60.70 | 64.09 | 59.80 | 49.09 |
| Thu 22-Oct-15 | 50.60 | 50.83 | 55.20 | 50.13 | 54.50 | 52.55 | 62.00 | 59.81 | 59.30 | 47.02 |
| Thu 29-Oct-15 | 52.50 | 51.14 | 56.90 | 51.84 | 56.60 | 52.88 | 63.80 | 59.84 | 63.00 | 52.54 |
| Thu 05-Nov-15 | 55.20 | 51.13 | 59.50 | 52.87 | 59.70 | 53.57 | 66.50 | 58.09 | 71.90 | 56.70 |
| Thu 05-Nov-15 | 55.20 | 51.13 | 59.50 | 52.87 | 59.70 | 53.57 | 66.50 | 58.09 | 71.90 | 56.70 |
| Thu 12-Nov-15 | 53.20 | 49.57 | 57.60 | 58.40 | 51.32 | 58.20 | 49.92 | 68.10 | 49.57 | |
| Thu 26-Nov-15 | 54.60 | 51.65 | 59.40 | 53.41 | 59.70 | 55.86 | 51.80 | 51.30 | 69.40 | 49.54 |
| Thu 03-Dec-15 | 50.60 | 52.01 | 55.20 | 52.72 | 55.80 | 52.72 | 48.30 | 49.18 | 65.70 | 49.89 |
| Thu 10-Dec-15 | 49.00 | 52.81 | 53.80 | 50.65 | 53.40 | 51.73 | 50.60 | 51.01 | 63.70 | 51.01 |
| Thu 17-Dec-15 | 50.30 | 54.25 | 55.10 | 50.93 | 54.80 | 51.30 | 50.60 | 50.93 | 67.10 | 57.94 |
| Thu 24-Dec-15 | 50.30 | 50.11 | 55.40 | 50.11 | 55.20 | 50.47 | 52.50 | 49.01 | 67.80 | 58.89 |
| Thu 31-Dec-15 | 50.20 | 48.63 | 55.30 | 48.63 | 55.20 | 50.09 | 52.30 | 50.09 | 65.00 | 51.19 |
| Thu 07-Jan-16 | 47.30 | 54.60 | 53.10 | 46.43 | 53.70 | 50.89 | 45.20 | 44.57 | 59.20 | 39.75 |
| Thu 14-Jan-16 | 44.20 | 42.91 | 49.60 | 44.80 | 50.10 | 52.02 | 40.00 | 41.77 | 49.70 | 37.59 |
| Thu 21-Jan-16 | 44.20 | 43.76 | 49.40 | 43.16 | 49.70 | 51.70 | 37.10 | 38.00 | 50.70 | 34.99 |
| Thu 28-Jan-16 | 44.00 | 43.05 | 48.80 | 44.61 | 49.30 | 51.08 | 35.70 | 37.55 | 51.70 | 36.32 |
| Thu 04-Feb-16 | 41.60 | 39.20 | 46.40 | 40.54 | 46.70 | 49.82 | 35.30 | 30.91 | 52.70 | 35.35 |
| Thu 11-Feb-16 | 39.40 | 36.50 | 43.90 | 38.49 | 44.10 | 41.77 | 34.10 | 32.42 | 53.70 | 38.38 |
| Thu 18-Feb-16 | 41.40 | 37.15 | 45.50 | 38.64 | 45.80 | 41.72 | 43.40 | 38.93 | 54.70 | 35.63 |
| Thu 25-Feb-16 | 41.70 | 39.23 | 45.80 | 40.70 | 46.10 | 43.39 | 43.30 | 48.04 | 55.70 | 42.32 |
| Thu 03-Mar-16 | 41.70 | 38.07 | 46.20 | 41.97 | 46.40 | 39.24 | 45.90 | 48.68 | 56.40 | 41.37 |
| Thu 10-Mar-16 | 46.20 | 43.03 | 51.20 | 44.65 | 51.50 | 46.63 | 52.00 | 53.49 | 58.80 | 44.44 |
| Thu 17-Mar-16 | 46.20 | 42.53 | 51.10 | 43.77 | 51.60 | 45.31 | 50.80 | 50.80 | 57.90 | 43.56 |
| Thu 24-Mar-16 | 49.40 | 46.76 | 53.50 | 47.57 | 54.40 | 48.02 | 50.20 | 53.21 | 57.60 | 43.75 |
| Thu 31-Mar-16 | 48.70 | 47.08 | 53.50 | 49.10 | 53.90 | 50.37 | 49.30 | 51.06 | 58.70 | 41.80 |
| Thu 07-Apr-16 | 49.20 | 47.43 | 53.70 | 48.79 | 54.10 | 50.32 | 49.80 | 51.12 | 56.10 | 45.38 |
| Thu 14-Apr-16 | 53.60 | 50.97 | 58.30 | 51.51 | 59.30 | 53.07 | 54.90 | 53.24 | 59.20 | 45.78 |
| Thu 21-Apr-16 | 52.60 | 51.07 | 56.50 | 52.41 | 58.10 | 53.29 | 53.30 | 52.04 | 57.80 | 50.70 |
| Thu 28-Apr-16 | 55.30 | 48.71 | 58.10 | 52.69 | 60.90 | 55.01 | 57.20 | 54.35 | 63.50 | 55.34 |
| Thu 05-May-16 | 52.30 | 50.59 | 54.10 | 52.97 | 58.00 | 56.02 | 52.20 | 61.12 | 61.60 | 45.50 |
| Thu 12-May-16 | 55.90 | 53.33 | 57.60 | 54.01 | 61.30 | 55.71 | 57.00 | 58.76 | 64.10 | 56.73 |
| Thu 19-May-16 | 58.40 | 56.13 | 60.80 | 56.48 | 64.00 | 58.56 | 60.60 | 66.53 | 63.80 | 55.78 |
| Thu 26-May-16 | 59.00 | 55.21 | 60.80 | 55.21 | 64.20 | 57.27 | 64.20 | 65.84 | 62.80 | 54.87 |
| Thu 02-Jun-16 | 57.80 | 55.63 | 59.70 | 55.63 | 63.10 | 58.40 | 67.20 | 68.76 | 65.40 | 58.74 |
| Thu 09-Jun-16 | 56.40 | 53.47 | 60.10 | 54.15 | 62.10 | 55.49 | 77.00 | 61.55 | 66.60 | 55.49 |
| Thu 16-Jun-16 | 53.20 | 49.61 | 56.70 | 50.30 | 59.00 | 51.68 | 60.60 | 57.19 | 63.00 | 52.71 |
| Thu 23-Jun-16 | 55.90 | 52.89 | 59.40 | 53.23 | 62.10 | 54.91 | 59.40 | 60.97 | 67.00 | 56.59 |
| Thu 30-Jun-16 | 53.80 | 50.52 | 57.70 | 51.55 | 61.10 | 53.27 | 58.80 | 56.70 | 69.80 | 59.11 |
| Thu 07-Jul-16 | 51.00 | 45.96 | 54.60 | 46.99 | 58.20 | 49.39 | 56.90 | 55.57 | 65.40 | 53.85 |
| Thu 14-Jul-16 | 49.60 | 47.64 | 52.80 | 49.02 | 57.00 | 51.07 | 54.90 | 56.90 | 64.60 | 56.90 |
Sources: NRCan, Bloomberg Oil Buyers Guide
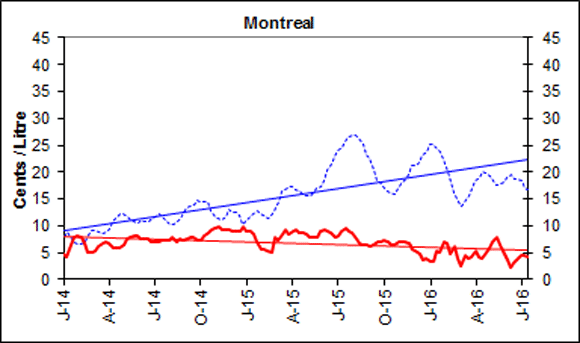
Gasoline Refining and Marketing Margins
Four-week rolling averages are used for gasoline refining and marketing margins.
The gasoline refining margin refers to the difference between the price of crude oil and the wholesale price at which the refiner can sell gasoline. The margin includes the costs associated with refining the product as well as a profit for the refiner.
Nationally, the four-week rolling average refining margin for the period ending July 19, 2016 was 21.5 cents per litre, which is one cent per litre lower than for the four-week period ending July 5, 2016.Compared to the same time last year, refining margins in Canada are seven cents per litre lower.
The gasoline marketing margin refers to the difference between the wholesale and retail price of gasoline before taxes are applied. This margin represents the costs associated with operating a service station.
Overall, the national average for marketing margins remained at 9 cents, the same as for four-week period ending July 5, 2016.
 |
 |
|
 |
 |
|
 |
 |
Text version
Figure 5
These graphs show the trend in refining and marketing costs and margins for selected centres in Canada and the national average.
| 4-week rolling average | Canada | Vancouver | Calgary | Toronto | Montreal | Halifax | ||||||
|---|---|---|---|---|---|---|---|---|---|---|---|---|
| Marketing Margin | Refining Margin | Marketing Margin | Refining Margin | Marketing Margin | Refining Margin | Marketing Margin | Refining Margin | Marketing Margin | Refining Margin | Marketing Margin | Refining Margin | |
| 2014-01-07 | 7.7 | 16.4 | 5.2 | 20.8 | 7.6 | 18.6 | 7.4 | 25.3 | 4.7 | 8.1 | 6.3 | 7.4 |
| 2014-01-14 | 7.3 | 16.7 | 5.5 | 21.2 | 6.8 | 19.7 | 7.6 | 25.6 | 4.1 | 8.7 | 5.8 | 8.1 |
| 2014-01-21 | 7.9 | 16.3 | 5.2 | 20.1 | 7.0 | 19.4 | 7.6 | 24.3 | 6.4 | 8.1 | 6.6 | 7.7 |
| 2014-01-28 | 7.9 | 15.6 | 6.6 | 20.1 | 6.7 | 20.1 | 8.7 | 24.1 | 7.8 | 6.9 | 7.4 | 6.7 |
| 2014-02-04 | 7.6 | 16.1 | 5.5 | 20.0 | 6.7 | 21.3 | 8.0 | 24.2 | 8.2 | 6.5 | 8.1 | 6.7 |
| 2014-02-11 | 7.3 | 16.4 | 5.0 | 16.9 | 6.1 | 18.0 | 8.0 | 20.7 | 7.8 | 6.5 | 7.6 | 7.3 |
| 2014-02-18 | 7.0 | 15.0 | 4.6 | 16.4 | 6.7 | 17.7 | 7.9 | 20.3 | 6.6 | 7.2 | 7.6 | 8.7 |
| 2014-02-25 | 6.5 | 14.3 | 4.3 | 12.5 | 6.5 | 14.3 | 7.8 | 16.8 | 5.1 | 8.2 | 7.4 | 10.2 |
| 2014-03-04 | 6.3 | 14.1 | 4.0 | 11.8 | 6.7 | 13.3 | 7.2 | 15.0 | 5.0 | 9.1 | 7.4 | 11.6 |
| 2014-03-11 | 6.7 | 12.6 | 4.7 | 14.0 | 7.3 | 16.0 | 7.1 | 16.0 | 5.3 | 9.1 | 8.8 | 11.2 |
| 2014-03-18 | 7.1 | 13.3 | 5.9 | 15.3 | 6.5 | 17.9 | 7.6 | 15.7 | 6.3 | 8.5 | 9.6 | 10.4 |
| 2014-03-25 | 7.7 | 14.3 | 6.8 | 19.7 | 7.4 | 22.1 | 7.8 | 18.0 | 6.6 | 8.4 | 9.6 | 9.7 |
| 2014-04-01 | 8.1 | 15.1 | 8.3 | 21.5 | 7.3 | 24.1 | 8.4 | 18.9 | 7.0 | 8.4 | 9.4 | 8.7 |
| 2014-04-08 | 8.1 | 16.6 | 8.3 | 22.4 | 8.1 | 24.5 | 8.5 | 19.0 | 6.8 | 9.5 | 8.4 | 9.3 |
| 2014-04-15 | 7.8 | 18.2 | 8.5 | 23.7 | 9.0 | 24.9 | 8.4 | 20.3 | 5.8 | 11.1 | 7.1 | 11.0 |
| 2014-04-22 | 7.8 | 18.9 | 8.6 | 24.4 | 8.5 | 25.2 | 8.6 | 21.3 | 5.7 | 11.5 | 7.2 | 12.1 |
| 2014-04-29 | 8.0 | 20.0 | 8.7 | 26.0 | 9.3 | 26.1 | 8.7 | 23.0 | 5.9 | 12.2 | 8.2 | 13.2 |
| 2014-05-06 | 8.4 | 20.3 | 9.0 | 26.7 | 9.6 | 26.3 | 8.8 | 23.7 | 6.4 | 12.3 | 9.4 | 14.0 |
| 2014-05-13 | 8.7 | 19.8 | 8.4 | 27.4 | 9.9 | 26.0 | 8.5 | 23.5 | 7.4 | 11.5 | 10.0 | 13.3 |
| 2014-05-20 | 8.6 | 19.6 | 8.1 | 27.2 | 9.7 | 25.2 | 8.2 | 22.9 | 8.0 | 11.0 | 9.6 | 12.3 |
| 2014-05-27 | 8.0 | 19.4 | 7.7 | 27.2 | 7.9 | 24.8 | 7.8 | 22.5 | 8.0 | 10.8 | 8.4 | 12.1 |
| 2014-06-03 | 7.7 | 18.8 | 7.4 | 26.4 | 7.4 | 23.9 | 7.7 | 21.4 | 8.1 | 10.6 | 8.1 | 11.3 |
| 2014-06-10 | 7.4 | 19.4 | 7.3 | 26.4 | 6.9 | 24.3 | 7.6 | 22.0 | 7.7 | 11.2 | 7.8 | 11.3 |
| 2014-06-17 | 7.3 | 19.8 | 7.1 | 26.9 | 6.8 | 24.7 | 7.3 | 23.0 | 7.6 | 10.8 | 7.7 | 10.7 |
| 2014-06-24 | 7.8 | 19.9 | 7.3 | 28.5 | 8.6 | 25.7 | 7.7 | 24.8 | 7.6 | 11.0 | 8.0 | 10.5 |
| 2014-07-01 | 7.8 | 20.7 | 6.9 | 29.1 | 9.3 | 25.1 | 7.3 | 25.8 | 6.9 | 11.3 | 7.8 | 10.7 |
| 2014-07-08 | 8.2 | 20.0 | 7.7 | 28.0 | 10.0 | 24.0 | 7.7 | 25.6 | 7.1 | 10.8 | 8.2 | 10.3 |
| 2014-07-15 | 8.6 | 19.4 | 7.6 | 27.9 | 11.4 | 23.8 | 7.8 | 26.4 | 6.9 | 12.2 | 8.9 | 11.6 |
| 2014-07-22 | 8.4 | 19.0 | 7.3 | 26.2 | 11.2 | 22.4 | 7.1 | 25.6 | 7.2 | 11.6 | 8.7 | 11.3 |
| 2014-07-29 | 8.3 | 18.4 | 7.9 | 25.1 | 9.9 | 22.0 | 7.4 | 25.2 | 7.1 | 11.1 | 8.3 | 11.0 |
| 2014-08-05 | 7.9 | 18.2 | 7.6 | 24.6 | 8.9 | 21.6 | 7.2 | 24.4 | 7.2 | 10.4 | 8.1 | 10.4 |
| 2014-08-12 | 8.0 | 18.4 | 8.1 | 25.1 | 9.7 | 21.8 | 7.3 | 24.4 | 7.8 | 10.3 | 7.6 | 10.5 |
| 2014-08-19 | 8.6 | 17.8 | 8.3 | 25.2 | 10.5 | 22.3 | 7.3 | 24.2 | 7.0 | 10.1 | 7.8 | 10.4 |
| 2014-08-26 | 8.6 | 18.6 | 8.1 | 25.9 | 11.4 | 23.4 | 6.9 | 24.5 | 7.5 | 11.3 | 7.2 | 11.6 |
| 2014-09-02 | 8.4 | 19.5 | 7.9 | 26.6 | 11.8 | 24.5 | 6.8 | 24.7 | 7.4 | 12.2 | 7.0 | 12.5 |
| 2014-09-09 | 8.5 | 19.6 | 7.6 | 26.4 | 10.1 | 25.2 | 7.1 | 24.1 | 7.6 | 13.4 | 7.5 | 13.3 |
| 2014-09-16 | 8.0 | 20.1 | 8.2 | 25.4 | 8.5 | 25.4 | 7.6 | 22.9 | 7.7 | 13.4 | 7.8 | 13.3 |
| 2014-09-23 | 8.2 | 19.3 | 8.3 | 24.1 | 7.8 | 24.8 | 8.0 | 21.8 | 7.8 | 13.8 | 8.1 | 13.7 |
| 2014-09-30 | 8.1 | 19.2 | 8.6 | 22.2 | 7.5 | 24.4 | 7.9 | 21.6 | 7.3 | 14.3 | 8.0 | 14.2 |
| 2014-10-07 | 8.4 | 18.1 | 9.2 | 20.2 | 9.2 | 23.7 | 7.6 | 20.8 | 7.2 | 14.5 | 8.9 | 14.9 |
| 2014-10-14 | 8.8 | 17.0 | 8.6 | 17.9 | 11.0 | 22.1 | 7.7 | 19.2 | 8.0 | 13.2 | 9.6 | 13.9 |
| 2014-10-21 | 9.2 | 15.7 | 9.2 | 17.7 | 12.4 | 23.0 | 7.7 | 20.4 | 8.8 | 14.5 | 9.3 | 15.4 |
| 2014-10-28 | 9.6 | 13.4 | 8.5 | 16.5 | 13.8 | 21.1 | 8.0 | 18.8 | 9.2 | 12.5 | 9.6 | 13.5 |
| 2014-11-04 | 9.3 | 15.2 | 8.1 | 18.5 | 12.3 | 22.2 | 8.4 | 19.9 | 9.4 | 11.5 | 8.9 | 12.3 |
| 2014-11-11 | 9.2 | 16.2 | 8.3 | 19.7 | 10.5 | 21.9 | 8.7 | 20.2 | 9.9 | 10.6 | 7.5 | 11.1 |
| 2014-11-18 | 9.2 | 16.4 | 8.4 | 22.4 | 10.7 | 22.9 | 8.8 | 21.4 | 9.1 | 11.0 | 8.5 | 11.3 |
| 2014-11-25 | 9.2 | 16.8 | 9.4 | 22.7 | 10.9 | 22.7 | 8.7 | 21.4 | 9.4 | 10.8 | 8.3 | 11.0 |
| 2014-12-02 | 9.4 | 16.8 | 9.4 | 22.9 | 11.8 | 22.4 | 8.8 | 22.2 | 9.1 | 13.1 | 8.5 | 12.9 |
| 2014-12-09 | 9.7 | 15.7 | 9.9 | 19.4 | 13.2 | 19.6 | 8.8 | 20.1 | 8.9 | 11.5 | 9.4 | 11.1 |
| 2014-12-16 | 9.5 | 14.2 | 9.5 | 19.2 | 12.5 | 20.2 | 8.5 | 20.9 | 9.1 | 12.5 | 9.3 | 11.7 |
| 2014-12-23 | 9.4 | 13.8 | 9.5 | 18.3 | 11.8 | 19.4 | 8.8 | 20.1 | 9.1 | 11.9 | 9.0 | 10.4 |
| 2014-12-30 | 9.6 | 12.9 | 9.8 | 17.5 | 11.8 | 18.4 | 8.9 | 19.0 | 9.7 | 10.3 | 9.0 | 8.9 |
| 2015-01-06 | 9.4 | 12.5 | 9.7 | 18.1 | 11.3 | 18.3 | 9.1 | 18.9 | 8.8 | 11.2 | 9.0 | 9.0 |
| 2015-01-13 | 9.6 | 13.0 | 10.1 | 17.6 | 10.7 | 17.1 | 9.4 | 17.8 | 8.9 | 11.6 | 9.0 | 8.9 |
| 2015-01-20 | 9.5 | 12.9 | 9.9 | 17.1 | 10.9 | 16.7 | 9.4 | 17.1 | 8.3 | 12.1 | 8.8 | 9.0 |
| 2015-01-27 | 8.7 | 13.9 | 9.4 | 17.2 | 8.9 | 17.4 | 9.3 | 17.0 | 7.0 | 12.7 | 7.9 | 9.2 |
| 2015-02-03 | 7.6 | 16.1 | 8.6 | 18.9 | 7.5 | 19.3 | 8.5 | 18.3 | 5.7 | 14.0 | 6.1 | 11.0 |
| 2015-02-10 | 7.5 | 17.2 | 8.6 | 19.3 | 7.6 | 19.6 | 8.6 | 18.0 | 5.5 | 11.8 | 5.4 | 9.4 |
| 2015-02-17 | 7.6 | 18.0 | 9.3 | 21.9 | 7.6 | 21.9 | 9.0 | 19.4 | 5.3 | 12.5 | 5.8 | 10.6 |
| 2015-02-24 | 7.8 | 18.5 | 10.1 | 23.7 | 8.6 | 22.5 | 9.3 | 20.0 | 5.0 | 12.0 | 6.2 | 10.4 |
| 2015-03-03 | 9.5 | 19.1 | 11.3 | 27.3 | 10.8 | 23.7 | 10.2 | 21.7 | 7.7 | 13.2 | 7.7 | 11.6 |
| 2015-03-10 | 9.5 | 20.2 | 10.5 | 30.6 | 11.0 | 24.4 | 10.1 | 23.6 | 7.3 | 14.5 | 8.9 | 12.6 |
| 2015-03-17 | 9.4 | 20.9 | 9.7 | 32.1 | 9.7 | 24.7 | 9.6 | 24.4 | 8.3 | 15.8 | 9.9 | 13.4 |
| 2015-03-24 | 9.5 | 22.6 | 8.2 | 34.7 | 9.2 | 27.1 | 8.6 | 26.2 | 9.2 | 16.8 | 10.3 | 13.9 |
| 2015-03-31 | 8.6 | 22.3 | 7.5 | 33.3 | 7.6 | 27.3 | 8.0 | 25.7 | 8.4 | 17.3 | 10.9 | 13.9 |
| 2015-04-07 | 8.6 | 22.4 | 7.9 | 31.2 | 7.2 | 26.5 | 7.9 | 24.4 | 9.1 | 17.2 | 10.6 | 13.4 |
| 2015-04-14 | 8.7 | 21.9 | 8.3 | 30.1 | 7.4 | 25.1 | 8.1 | 23.5 | 9.2 | 17.1 | 10.6 | 13.2 |
| 2015-04-21 | 8.6 | 20.7 | 9.2 | 27.3 | 7.5 | 21.7 | 8.5 | 21.4 | 8.7 | 16.4 | 10.6 | 12.6 |
| 2015-04-28 | 8.8 | 20.0 | 9.0 | 27.3 | 7.8 | 19.6 | 8.4 | 21.2 | 8.6 | 16.0 | 10.6 | 12.3 |
| 2015-05-05 | 9.2 | 19.6 | 9.6 | 28.2 | 6.8 | 18.9 | 8.8 | 21.2 | 8.3 | 15.7 | 10.5 | 12.4 |
| 2015-05-12 | 9.3 | 19.2 | 9.7 | 29.7 | 7.9 | 19.0 | 8.8 | 21.8 | 7.8 | 15.8 | 11.0 | 12.5 |
| 2015-05-19 | 9.2 | 19.3 | 10.0 | 29.6 | 7.0 | 18.5 | 9.1 | 21.2 | 7.9 | 16.0 | 11.1 | 12.9 |
| 2015-05-26 | 9.0 | 20.1 | 10.3 | 30.0 | 7.1 | 19.7 | 9.0 | 21.9 | 7.9 | 17.0 | 10.6 | 14.0 |
| 2015-06-02 | 9.8 | 20.0 | 10.6 | 29.1 | 9.4 | 19.5 | 9.7 | 21.3 | 8.9 | 17.1 | 11.3 | 14.1 |
| 2015-06-09 | 9.9 | 20.7 | 10.0 | 29.6 | 9.9 | 20.9 | 9.6 | 22.4 | 9.2 | 18.2 | 10.9 | 15.4 |
| 2015-06-16 | 10.2 | 22.6 | 10.1 | 30.6 | 12.0 | 23.0 | 9.6 | 23.8 | 8.9 | 20.1 | 10.2 | 17.4 |
| 2015-06-23 | 10.2 | 23.5 | 9.4 | 31.3 | 12.3 | 24.0 | 9.7 | 24.4 | 8.7 | 20.7 | 10.6 | 18.1 |
| 2015-06-30 | 9.2 | 25.0 | 8.4 | 33.6 | 10.6 | 26.9 | 8.7 | 27.4 | 7.9 | 22.5 | 9.6 | 20.2 |
| 2015-07-07 | 9.4 | 26.1 | 9.2 | 34.1 | 10.5 | 28.1 | 9.1 | 28.7 | 8.2 | 23.3 | 8.4 | 21.1 |
| 2015-07-14 | 9.6 | 27.6 | 9.2 | 37.0 | 9.8 | 30.8 | 9.4 | 32.4 | 9.1 | 23.7 | 8.4 | 21.6 |
| 2015-07-21 | 10.0 | 28.6 | 10.3 | 37.8 | 6.9 | 31.5 | 9.8 | 33.3 | 9.7 | 23.7 | 8.4 | 21.4 |
| 2015-07-28 | 9.6 | 30.0 | 10.2 | 42.8 | 8.2 | 36.5 | 9.7 | 37.6 | 9.1 | 26.6 | 8.8 | 23.9 |
| 2015-08-04 | 9.1 | 31.2 | 9.8 | 44.6 | 5.6 | 38.2 | 9.7 | 38.4 | 8.6 | 27.0 | 8.9 | 23.9 |
| 2015-08-11 | 8.5 | 31.2 | 8.7 | 44.8 | 6.2 | 39.6 | 8.8 | 38.0 | 7.5 | 26.7 | 9.3 | 23.3 |
| 2015-08-18 | 6.2 | 32.8 | 8.5 | 43.7 | 6.6 | 42.3 | 8.6 | 36.9 | 6.7 | 26.4 | 8.9 | 22.9 |
| 2015-08-25 | 6.9 | 33.0 | 9.1 | 41.4 | 10.2 | 41.6 | 9.1 | 34.6 | 6.4 | 25.1 | 8.9 | 21.6 |
| 2015-09-01 | 5.1 | 32.0 | 9.8 | 38.5 | 13.8 | 39.5 | 9.6 | 32.2 | 6.5 | 23.1 | 8.0 | 19.7 |
| 2015-09-08 | 5.2 | 30.0 | 10.4 | 36.0 | 12.8 | 37.4 | 10.0 | 30.6 | 6.2 | 22.6 | 7.4 | 19.0 |
| 2015-09-15 | 6.5 | 26.4 | 10.3 | 30.9 | 12.4 | 31.6 | 10.4 | 27.2 | 6.3 | 20.3 | 7.8 | 16.7 |
| 2015-09-22 | 6.1 | 24.0 | 10.0 | 26.0 | 11.2 | 28.7 | 10.1 | 23.6 | 7.0 | 18.6 | 7.5 | 15.0 |
| 2015-09-29 | 8.0 | 22.7 | 9.3 | 24.8 | 10.2 | 30.5 | 9.3 | 22.9 | 7.1 | 18.6 | 8.1 | 15.1 |
| 2015-10-06 | 8.2 | 22.1 | 8.7 | 23.1 | 11.9 | 30.7 | 9.2 | 21.1 | 7.3 | 16.6 | 8.3 | 13.4 |
| 2015-10-13 | 8.6 | 21.9 | 8.8 | 23.4 | 12.8 | 32.3 | 8.7 | 20.5 | 6.9 | 15.8 | 7.9 | 12.6 |
| 2015-10-20 | 8.8 | 20.9 | 9.1 | 23.4 | 14.1 | 30.9 | 8.5 | 19.8 | 6.5 | 15.9 | 7.7 | 12.6 |
| 2015-10-27 | 8.9 | 20.4 | 9.4 | 22.8 | 13.9 | 29.3 | 8.6 | 18.9 | 6.4 | 15.3 | 7.6 | 11.6 |
| 2015-11-03 | 9.0 | 20.6 | 10.8 | 24.9 | 12.3 | 29.8 | 9.0 | 19.6 | 6.9 | 16.1 | 7.2 | 12.1 |
| 2015-11-10 | 9.1 | 21.4 | 10.6 | 28.4 | 12.3 | 29.5 | 9.0 | 20.9 | 7.0 | 16.7 | 7.1 | 12.4 |
| 2015-11-17 | 8.9 | 22.4 | 9.5 | 31.3 | 11.9 | 29.4 | 8.7 | 22.7 | 6.9 | 18.1 | 7.5 | 13.7 |
| 2015-11-24 | 9.3 | 22.6 | 9.6 | 33.4 | 12.8 | 26.4 | 8.7 | 23.5 | 6.6 | 18.5 | 7.7 | 14.1 |
| 2015-12-01 | 9.1 | 22.9 | 9.0 | 36.1 | 12.6 | 25.0 | 8.6 | 25.8 | 5.5 | 19.9 | 7.8 | 15.4 |
| 2015-12-08 | 8.8 | 22.3 | 8.7 | 35.1 | 10.7 | 22.0 | 8.5 | 25.2 | 5.2 | 19.1 | 8.6 | 14.5 |
| 2015-12-15 | 8.6 | 22.9 | 9.7 | 35.4 | 8.7 | 22.0 | 9.1 | 25.5 | 4.8 | 17.7 | 7.6 | 14.9 |
| 2015-12-22 | 8.2 | 24.2 | 9.5 | 36.7 | 8.3 | 23.9 | 9.2 | 26.4 | 3.7 | 17.8 | 7.5 | 16.0 |
| 2015-12-29 | 8.3 | 24.6 | 9.5 | 38.3 | 8.5 | 25.8 | 9.2 | 27.0 | 4.0 | 22.3 | 7.7 | 17.4 |
| 2016-01-05 | 8.3 | 25.6 | 9.7 | 38.0 | 8.3 | 26.4 | 9.6 | 27.3 | 3.4 | 23.0 | 7.0 | 17.9 |
| 2016-01-12 | 8.2 | 25.4 | 8.6 | 37.4 | 9.4 | 25.9 | 8.8 | 28.1 | 3.5 | 24.3 | 8.2 | 19.0 |
| 2016-01-19 | 8.4 | 24.3 | 8.4 | 33.6 | 9.0 | 22.9 | 8.3 | 26.9 | 5.3 | 23.5 | 8.7 | 18.0 |
| 2016-01-26 | 8.6 | 23.5 | 8.1 | 31.4 | 9.6 | 21.5 | 7.9 | 27.5 | 6.8 | 23.9 | 8.9 | 18.4 |
| 2016-02-02 | 9.2 | 22.1 | 8.0 | 28.7 | 11.0 | 18.9 | 7.5 | 26.6 | 8.6 | 22.9 | 9.2 | 17.5 |
| 2016-02-09 | 9.5 | 21.6 | 8.8 | 27.7 | 11.2 | 17.9 | 7.6 | 26.4 | 9.8 | 21.7 | 8.5 | 16.4 |
| 2016-02-16 | 9.5 | 22.0 | 8.8 | 27.4 | 11.2 | 17.6 | 7.6 | 26.1 | 9.8 | 21.1 | 8.5 | 15.8 |
| 2016-02-23 | 9.8 | 18.1 | 10.8 | 25.0 | 10.1 | 14.0 | 10.0 | 22.2 | 6.2 | 17.2 | 7.7 | 12.8 |
| 2016-03-01 | 8.7 | 18.0 | 10.4 | 26.3 | 7.5 | 15.9 | 10.0 | 21.3 | 3.8 | 16.5 | 7.6 | 12.3 |
| 2016-03-08 | 8.1 | 18.6 | 10.4 | 25.4 | 6.9 | 16.4 | 10.1 | 18.3 | 2.5 | 14.5 | 6.7 | 10.4 |
| 2016-03-15 | 8.3 | 18.9 | 9.8 | 26.6 | 8.5 | 19.5 | 9.6 | 18.5 | 4.5 | 15.2 | 6.4 | 10.8 |
| 2016-03-22 | 8.0 | 19.3 | 9.2 | 26.9 | 8.3 | 20.3 | 9.9 | 18.3 | 3.9 | 15.2 | 6.8 | 10.6 |
| 2016-03-29 | 8.3 | 20.2 | 9.3 | 27.5 | 9.7 | 21.8 | 10.0 | 19.9 | 4.2 | 16.7 | 7.2 | 11.9 |
| 2016-04-05 | 8.5 | 21.4 | 9.1 | 29.0 | 9.2 | 23.7 | 10.0 | 22.8 | 5.3 | 19.1 | 8.9 | 14.2 |
| 2016-04-12 | 8.5 | 22.7 | 9.0 | 29.2 | 9.2 | 24.1 | 10.3 | 24.4 | 4.1 | 20.4 | 9.8 | 15.7 |
| 2016-04-19 | 8.5 | 23.9 | 9.1 | 28.9 | 9.5 | 24.5 | 10.1 | 25.7 | 4.0 | 20.9 | 10.3 | 16.4 |
| 2016-04-26 | 8.5 | 24.4 | 9.3 | 29.0 | 8.4 | 25.1 | 10.2 | 26.5 | 5.1 | 21.0 | 10.6 | 16.8 |
| 2016-05-03 | 8.9 | 24.8 | 9.6 | 27.9 | 9.5 | 24.6 | 10.1 | 25.7 | 5.7 | 20.3 | 9.5 | 16.6 |
| 2016-05-10 | 9.0 | 24.0 | 9.7 | 28.5 | 8.7 | 24.5 | 9.9 | 25.8 | 6.9 | 19.8 | 9.9 | 16.8 |
| 2016-05-17 | 9.4 | 23.7 | 10.3 | 27.3 | 9.0 | 22.9 | 10.3 | 24.0 | 7.8 | 18.5 | 9.0 | 16.2 |
| 2016-05-24 | 9.3 | 23.6 | 9.8 | 27.8 | 10.4 | 24.4 | 10.3 | 24.8 | 6.5 | 19.3 | 9.0 | 17.2 |
| 2016-05-31 | 8.8 | 23.4 | 10.0 | 25.7 | 8.6 | 24.1 | 10.3 | 23.4 | 5.2 | 18.4 | 9.5 | 16.5 |
| 2016-06-07 | 8.6 | 23.9 | 10.1 | 25.9 | 9.1 | 27.0 | 10.0 | 23.8 | 3.6 | 19.3 | 9.4 | 17.0 |
| 2016-06-14 | 8.0 | 23.9 | 9.5 | 26.1 | 8.2 | 30.5 | 9.5 | 23.5 | 2.2 | 19.5 | 10.5 | 16.8 |
| 2016-06-21 | 8.6 | 23.2 | 9.7 | 26.3 | 9.5 | 30.0 | 9.3 | 22.4 | 3.2 | 18.5 | 10.5 | 15.6 |
| 2016-06-28 | 8.8 | 22.7 | 9.3 | 27.9 | 11.0 | 29.4 | 9.2 | 22.6 | 3.8 | 18.1 | 9.1 | 14.7 |
| 2016-07-05 | 8.7 | 22.3 | 8.8 | 29.2 | 9.8 | 27.6 | 9.2 | 22.6 | 4.4 | 17.7 | 8.5 | 14.1 |
| 2016-07-12 | 8.8 | 21.4 | 9.2 | 30.7 | 10.1 | 24.8 | 9.4 | 22.9 | 4.4 | 16.9 | 8.2 | 13.3 |
| 2016-07-19 | 8.2 | 21.5 | 9.2 | 31.6 | 8.3 | 24.2 | 8.9 | 23.3 | 4.1 | 16.6 | 5.9 | 14.8 |
Source: NRCan
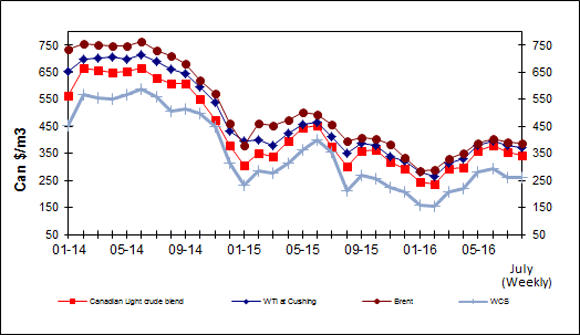
Crude Oil Overview
For the two weeks ending July 19, 2016, prices for the three light crude benchmarks averaged between CAD$343.47/m3 and CAD$385.71/m3 (U.S.$41.98 and U.S.$47.14 per barrel).
Canadian light crude oil prices at Edmonton decreased by CAD$24.73/m3 (U.S.$3.50 per barrel) from two weeks ago, West Texas Intermediate (WTI) decreased by CAD$18.88/m3 (U.S.$2.48 per barrel) and Brent decreased by CAD$16.54/m3 (U.S.$2.25 per barrel). The price of Western Canada Select decreased by CAD$26.32/ m3 (U.S.$3.42) from two weeks ago.
The discount for Canadian light oil, as measured by the Canadian Light Sweet differential to WTI widened from an average of CAD$23.61/m3 (U.S.$2.58) for the two-weeks ending July 5, 2016 to CAD$29.45/m3 (U.S.$3.60 per barrel) for the two weeks ending July 19, 2016.
The discount for Canadian heavy oil, as measured by the Western Canadian Select price differential to WTI widened over the past two weeks from an average of CAD$106.34/m3 (U.S.$12.96 per barrel) over the two weeks ending July 5, 2016 to an average of CAD$113.77/m3 (U.S.$13.91 per barrel) for the two weeks ending July 19, 2016.
For the week ending July 15, 2016, the U.S. Energy Information Administration (EIA) data showed a 2.3 million barrel decrease in U.S. commercial crude inventories week-over-week, with total stocks now at 519.5 million barrels. U.S. crude oil inventories are at historically high levels for this time of year.
Figure 6: Crude Oil Price Comparisons
Text version
Figure 6
This graph shows crude oil prices for Canadian Light Sweet, WTI, Brent and WCS. The average weekly prices for the week of July 11, 2016, were $343.83/cubic metre, $372.75/cubic metre, $385.67/cubic metre and $259.25/cubic metre for the Canadian Light, WTI, Brent and WCS, respectively.
| Dates | Canadian Light Sweet |
WTI | Brent | WCS |
|---|---|---|---|---|
| 01/13 | 549.97 | 592.14 | 699.83 | 387.55 |
| 02/13 | 553.76 | 605.29 | 736.06 | 370.93 |
| 03/13 | 560.66 | 598.93 | 705.36 | 430.10 |
| 04/13 | 571.20 | 590.06 | 663.78 | 441.27 |
| 05/13 | 598.81 | 608.31 | 662.59 | 519.16 |
| 06/13 | 577.25 | 630.51 | 680.52 | 489.10 |
| 07/13 | 664.03 | 685.36 | 703.73 | 592.16 |
| 08/13 | 665.21 | 697.44 | 722.47 | 595.65 |
| 09/13 | 647.06 | 691.84 | 723.16 | 543.60 |
| 10/13 | 592.41 | 655.54 | 713.92 | 483.77 |
| 11/13 | 511.65 | 620.13 | 711.21 | 413.23 |
| 12/13 | 524.69 | 655.42 | 740.65 | 394.48 |
| 01/14 | 561.87 | 651.27 | 735.43 | 452.06 |
| 02/14 | 665.35 | 699.89 | 756.56 | 566.93 |
| 03/14 | 655.67 | 701.90 | 752.47 | 554.81 |
| 04/14 | 647.62 | 704.92 | 747.57 | 550.77 |
| 05/14 | 652.85 | 697.62 | 748.13 | 566.87 |
| 06/14 | 665.50 | 715.93 | 762.22 | 589.57 |
| 07/14 | 629.45 | 690.70 | 730.08 | 558.81 |
| 08/14 | 606.25 | 660.32 | 710.46 | 507.84 |
| 09/14 | 608.92 | 644.03 | 681.65 | 515.00 |
| 10/14 | 551.84 | 594.78 | 621.20 | 497.90 |
| 11/14 | 474.20 | 540.12 | 569.75 | 447.90 |
| 12/14 | 378.11 | 430.68 | 459.36 | 313.77 |
| 01/15 | 304.92 | 359.85 | 377.71 | 232.32 |
| 02/15 | 350.67 | 399.16 | 461.37 | 287.18 |
| 03-15 | 339.32 | 379.25 | 452.57 | 269.44 |
| 04-15 | 394.52 | 422.81 | 471.56 | 313.37 |
| 05-15 | 444.34 | 455.08 | 502.89 | 387.66 |
| 06-15 | 453.67 | 444.84 | 472.46 | 377.74 |
| 07-15 | 373.96 | 411.43 | 457.53 | 353.39 |
| 08-15 | 303.26 | 351.68 | 395.72 | 210.71 |
| 09-15 | 356.80 | 389.09 | 406.85 | 267.30 |
| 10-15 | 363.10 | 380.00 | 404.44 | 258.44 |
| 11-15 | 319.23 | 339.52 | 383.58 | 224.73 |
| 12-15 | 292.17 | 321.73 | 336.10 | 206.42 |
| 01-16 | 245.04 | 281.71 | 285.42 | 156.75 |
| 02-16 | 236.45 | 263.21 | 290.71 | 153.29 |
| 03-16 | 292.79 | 312.53 | 331.26 | 206.60 |
| 04-16 | 299.15 | 331.34 | 350.57 | 220.91 |
|
05-16 |
360.18 | 380.57 | 388.53 | 281.90 |
| 06-16 | 377.53 | 395.36 | 404.78 | 294.42 |
| Week of 4 July | 355.16 | 377.40 | 392.03 | 261.67 |
| Week of July 11 | 343.83 | 372.75 | 385.67 | 259.25 |
Sources: NRCan
| Crude Oil Types | Two- Weeks Ending: 2016-07-19 |
Change From: Two weeks prior |
Change From: Last Year |
|||
|---|---|---|---|---|---|---|
| $Can/ m3 |
$US/ bbl |
$Can/ m3 |
$US/ bbl |
$Can/ m3 |
$US/ bbl |
|
| Canadian Light | 343.47 | 41.98 | -24.73 | -3.50 | -37.58 | -5.51 |
| WTI | 372.92 | 45.58 | -18.88 | -2.48 | -44.16 | -6.03 |
| Brent | 385.71 | 47.14 | -16.54 | -2.25 | -80.38 | -10.53 |
| WCS | 259.15 | 31.68 | -26.32 | -3.42 | -43.02 | -5.73 |
Source: NRCan
Download the report
Fuel Focus - Printable Version [PDF, 220 KB]
To read Adobe Acrobat® files, you will need to download and install the free Acrobat Reader® software available from Adobe Systems Incorporated.
Page details
- Date modified: