
Fuel Focus, February 21, 2014
Table of Contents
- National Overview
- Recent Developments
- Retail Gasoline Overview
- Wholesale Gasoline Prices
- Gasoline Refining and Marketing Margins
- Crude Oil Overview
- Supplement
- Download the report
National Overview
Average Canadian Retail Gasoline Prices Increased 2 Cents per Litre from Last Week
Canadian retail pump prices, for the week ending February 18, 2014, increased by nearly 2 cents per litre to $1.29 per litre—a five-month high. However, this represents a 1 cent-per-litre decrease from last year’s level at the same time.
Diesel fuel prices increased by less than 1 cent per litre to $1.45 per litre compared to the previous week. This is an increase of 10 cents per litre from the same period last year. Furnace oil prices declined marginally by less than 1 cent per litre from the previous week to an average of $1.32 per litre.
Average retail gasoline prices rose on higher wholesale gasoline prices, which in turn reflected higher crude oil prices.
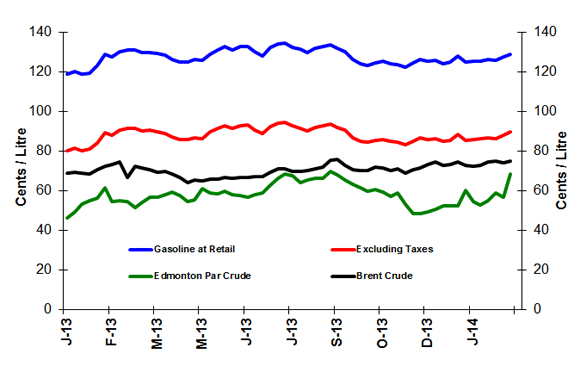
Figure 1: Crude Oil and Regular Gasoline Price Comparison
(National Average)
Text version
Figure 1
The graph shows prices in cents per litre for gasoline at retail, gasoline excluding taxes, and Edmonton Par and Brent crude oil prices. Gasoline prices ended the period of February 18, 2014, at 129.3 cents per litre, excluding taxes at 89.8 cents per litre, Edmonton Par at 68.5 cents per litre and Brent at 75.3 cents per litre.
| Dates | Gasoline at retail | Excluding Taxes | Edmonton Par crude | Brent crude |
|---|---|---|---|---|
| 01/01/2013 | 118.9 | 80.4 | 46.6 | 69.3 |
| 08/01/2013 | 120.6 | 81.9 | 49.4 | 69.5 |
| 15/01/2013 | 118.9 | 80.3 | 53.7 | 69.2 |
| 22/01/2013 | 119.7 | 81.1 | 55.2 | 68.7 |
| 29/01/2013 | 123.3 | 84.3 | 56.6 | 70.7 |
| 05/02/2013 | 129.2 | 89.7 | 61.9 | 72.5 |
| 12/02/2013 | 127.7 | 88.4 | 54.8 | 73.5 |
| 19/02/2013 | 130.5 | 90.9 | 55.3 | 74.6 |
| 26/02/2013 | 131.2 | 91.6 | 54.7 | 67.1 |
| 05/03/2013 | 131.2 | 91.6 | 51.8 | 72.5 |
| 12/03/2013 | 129.9 | 90.4 | 54.2 | 71.8 |
| 19/03/2013 | 130.1 | 90.7 | 56.7 | 70.6 |
| 26/03/2013 | 129.4 | 90.0 | 57.0 | 69.7 |
| 02/04/2013 | 128.7 | 89.3 | 58.4 | 69.9 |
| 09/04/2013 | 126.5 | 87.4 | 59.5 | 68.9 |
| 16/04/2013 | 125.0 | 86.0 | 58.0 | 67.0 |
| 23/04/2013 | 125.1 | 85.9 | 54.8 | 64.4 |
| 30/04/2013 | 126.3 | 87.0 | 55.8 | 65.5 |
| 07/05/2013 | 126.0 | 86.7 | 61.4 | 65.1 |
| 14/05/2013 | 129.3 | 89.8 | 59.1 | 66.1 |
| 21/05/2013 | 131.4 | 91.8 | 58.8 | 66.1 |
| 28/05/2013 | 132.9 | 93.2 | 60.0 | 66.9 |
| 04/06/2013 | 131.1 | 91.5 | 58.1 | 66.6 |
| 11/06/2013 | 132.9 | 93.2 | 57.8 | 66.8 |
| 18/06/2013 | 133.1 | 93.3 | 57.0 | 66.8 |
| 25/06/2013 | 130.5 | 91.0 | 58.0 | 67.4 |
| 02/07/2013 | 128.3 | 88.9 | 59.0 | 67.2 |
| 09/07/2013 | 132.4 | 92.6 | 63.1 | 69.6 |
| 16/07/2013 | 134.4 | 94.3 | 66.6 | 71.2 |
| 23/07/2013 | 134.7 | 94.6 | 68.7 | 71.1 |
| 30/07/2013 | 132.7 | 92.8 | 67.9 | 69.8 |
| 06/08/2013 | 131.5 | 91.7 | 64.1 | 70.1 |
| 13/08/2013 | 130.0 | 90.3 | 65.6 | 70.3 |
| 20/08/2013 | 132.0 | 92.2 | 66.4 | 71.3 |
| 27/08/2013 | 133.0 | 93.0 | 66.4 | 72.3 |
| 03/09/2013 | 133.9 | 93.8 | 70.2 | 75.5 |
| 10/09/2013 | 132.1 | 92.2 | 68.1 | 76.1 |
| 17/09/2013 | 130.6 | 90.8 | 65.8 | 73.0 |
| 24/09/2013 | 126.4 | 87.1 | 63.7 | 70.8 |
| 01/10/2013 | 124.3 | 85.2 | 61.9 | 70.3 |
| 08/10/2013 | 123.6 | 84.6 | 60.1 | 70.6 |
| 15/10/2013 | 124.8 | 85.6 | 60.9 | 71.9 |
| 22/10/2013 | 125.5 | 86.2 | 59.7 | 71.7 |
| 29/10/2013 | 124.4 | 85.2 | 57.4 | 70.6 |
| 05/11/2013 | 123.7 | 84.6 | 58.9 | 71.1 |
| 12/11/2013 | 122.6 | 83.6 | 53.5 | 69.0 |
| 19/11/2013 | 124.6 | 85.3 | 48.7 | 70.7 |
| 26/11/2013 | 126.4 | 86.9 | 48.6 | 71.8 |
| 03/12/2013 | 125.4 | 86.1 | 49.4 | 73.6 |
| 10/12/2013 | 125.9 | 86.5 | 50.9 | 74.9 |
| 17/12/2013 | 124.5 | 85.2 | 52.5 | 73.0 |
| 24/12/2013 | 125.0 | 85.6 | 52.6 | 73.5 |
| 31/12/2013 | 128.3 | 88.6 | 52.6 | 74.9 |
| 07/01/2014 | 125.0 | 85.6 | 60.6 | 73.0 |
| 14/01/2014 | 125.6 | 86.2 | 54.6 | 72.6 |
| 21/01/2014 | 125.7 | 86.3 | 52.8 | 73.2 |
| 28/01/2014 | 126.6 | 87.0 | 55.1 | 74.9 |
| 04/02/2014 | 125.9 | 86.7 | 59.0 | 75.1 |
| 11/02/2014 | 127.6 | 88.2 | 57.0 | 74.4 |
| 18/02/2014 | 129.3 | 89.8 | 68.5 | 75.3 |
Figure 2: Weekly Regular Gasoline Prices
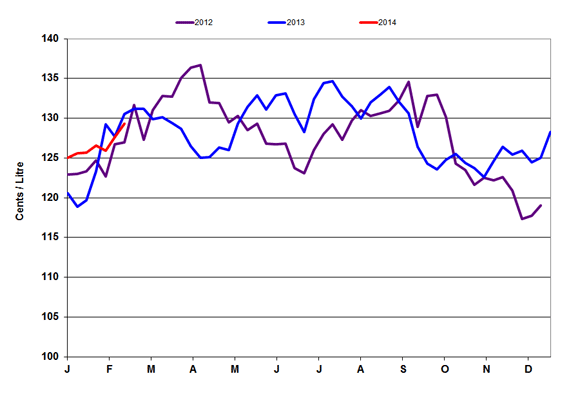
Text version
Figure 2
This graph shows the gasoline price trends from 2012 to 2014.
| Date | 2012 Gasoline at Retail | Date | 2013 Gasoline at Retail | Date | 2014 Gasoline at Retail |
|---|---|---|---|---|---|
| 12-01-03 | 120.60 | 13-01-01 | 118.90 | 13-12-31 | 128.30 |
| 12-01-10 | 122.90 | 13-01-08 | 120.60 | 14-01-07 | 125.00 |
| 12-01-17 | 123.00 | 13-01-15 | 118.90 | 14-01-14 | 125.60 |
| 12-01-24 | 123.30 | 13-01-22 | 119.70 | 14-01-21 | 125.70 |
| 12-01-31 | 124.70 | 13-01-29 | 123.30 | 14-01-28 | 126.60 |
| 12-02-07 | 122.70 | 13-02-05 | 129.20 | 14-02-04 | 125.90 |
| 12-02-14 | 126.70 | 13-02-12 | 127.70 | 14-02-11 | 127.60 |
| 12-02-21 | 127.00 | 13-02-19 | 130.50 | 14-02-18 | 129.30 |
| 12-02-28 | 131.70 | 13-02-26 | 131.20 | 14-02-25 | |
| 12-03-06 | 127.30 | 13-03-05 | 131.20 | 14-03-04 | |
| 12-03-13 | 131.00 | 13-03-12 | 129.90 | 14-03-11 | |
| 12-03-20 | 132.80 | 13-03-19 | 130.10 | 14-03-18 | |
| 12-03-27 | 132.70 | 13-03-26 | 129.40 | 14-03-25 | |
| 12-04-03 | 135.10 | 13-04-02 | 128.70 | 14-04-01 | |
| 12-04-10 | 136.40 | 13-04-09 | 126.50 | 14-04-08 | |
| 12-04-17 | 136.70 | 13-04-16 | 125.00 | 14-04-15 | |
| 12-04-24 | 132.00 | 13-04-23 | 125.10 | 14-04-22 | |
| 12-05-01 | 131.90 | 13-04-30 | 126.30 | 14-04-29 | |
| 12-05-08 | 129.50 | 13-05-07 | 126.00 | 14-05-06 | |
| 12-05-15 | 130.30 | 13-05-14 | 129.30 | 14-05-13 | |
| 12-05-22 | 128.50 | 13-05-21 | 131.40 | 14-05-20 | |
| 12-05-29 | 129.30 | 13-05-28 | 132.90 | 14-05-27 | |
| 12-06-05 | 126.80 | 13-06-04 | 131.10 | 14-06-03 | |
| 12-06-12 | 126.70 | 13-06-11 | 132.90 | 14-06-10 | |
| 12-06-19 | 126.80 | 13-06-18 | 133.10 | 14-06-17 | |
| 12-06-26 | 123.70 | 13-06-25 | 130.50 | 14-06-24 | |
| 12-07-03 | 123.10 | 13-07-02 | 128.30 | 14-07-01 | |
| 12-07-10 | 126.00 | 13-07-09 | 132.40 | 14-07-08 | |
| 12-07-17 | 128.00 | 13-07-16 | 134.40 | 14-07-15 | |
| 12-07-24 | 129.20 | 13-07-23 | 134.70 | 14-07-22 | |
| 12-07-31 | 127.30 | 13-07-30 | 132.70 | 14-07-29 | |
| 12-08-07 | 129.70 | 13-08-06 | 131.50 | 14-08-05 | |
| 12-08-14 | 131.00 | 13-08-13 | 130.00 | 14-08-12 | |
| 12-08-21 | 130.30 | 13-08-20 | 132.00 | 14-08-19 | |
| 12-08-28 | 130.60 | 13-08-27 | 133.00 | 14-08-26 | |
| 12-09-04 | 130.90 | 13-09-03 | 133.90 | 14-09-02 | |
| 12-09-11 | 132.20 | 13-09-10 | 132.10 | 14-09-09 | |
| 12-09-18 | 134.60 | 13-09-17 | 130.60 | 14-09-16 | |
| 12-09-25 | 128.90 | 13-09-24 | 126.40 | 14-09-23 | |
| 12-10-02 | 132.80 | 13-10-01 | 124.30 | 14-09-30 | |
| 12-10-09 | 133.00 | 13-10-08 | 123.60 | 14-10-07 | |
| 12-10-16 | 130.10 | 13-10-15 | 124.80 | 14-10-14 | |
| 12-10-23 | 124.30 | 13-10-22 | 125.50 | 14-10-21 | |
| 12-10-30 | 123.50 | 13-10-29 | 124.40 | 14-10-28 | |
| 12-11-06 | 121.60 | 13-11-05 | 123.70 | 14-11-04 | |
| 12-11-13 | 122.50 | 13-11-12 | 122.60 | 14-11-11 | |
| 12-11-20 | 122.20 | 13-11-19 | 124.60 | 14-11-18 | |
| 12-11-27 | 122.60 | 13-11-26 | 126.40 | 14-11-25 | |
| 12-12-04 | 120.90 | 13-12-03 | 125.40 | 14-12-02 | |
| 12-12-11 | 117.30 | 13-12-10 | 125.90 | 14-12-09 | |
| 12-12-18 | 117.70 | 13-12-17 | 124.50 | 14-12-16 | |
| 12-12-25 | 119.00 | 13-12-24 | 125.00 | 14-12-23 | |
| 13-12-31 | 128.30 | 14-12-30 |
| ¢/L | Week of: 2014-02-18 | Change from: Previous Week | Change from: Last Year |
|---|---|---|---|
| Gasoline | 129.3 | +1.7 | -1.2 |
| Diesel | 144.5 | +0.4 | +9.5 |
| Furnace Oil | 132.1 | -0.1 | +5.9 |
Source: NRCan
| 2014-02-18 | ¢/kilogram | ¢/L gasoline equivalent | ¢/L diesel equivalent |
|---|---|---|---|
| Vancouver | 114.6 | 75.6 | 78.4 |
| Edmonton | 115.1 | 75.9 | 78.7 |
| Toronto | 110.6 | 73.0 | 75.6 |
Source: ¢/kg Kent Marketing Services Limited
Recent Developments
- Oil Market Report: Unexpectedly strong deliveries in the United States lifted global oil demand for the final quarter of last year by 135,000 barrels per day higher than originally forecast. Curtailments in China and elsewhere partly offset the U.S. increase. Total OECD commercial oil inventories plummeted by 53.6 million barrels per day in November, their steepest monthly decline since December 2011. (Source: International Energy Agency )
- New Motor Vehicle Sales: The number of new motor vehicles (passenger and light trucks) sold in Canada from January to December 2013 rose by 59,000 units (+3%) to 1.8 million units compared to the same period in 2012. New motor vehicle sales rose in all provinces, except for Quebec, where sales dropped by nearly 4,000 units (-1%) to 419,000 units. New vehicle sales increased the most in Ontario and Alberta, by 24,000 and 15,000 units, respectively. (Source: The Daily )
- Update on Propane Supply Disruption: While propane distributors servicing the eastern Ontario and western Quebec region recognize the market for propane remains tight, the industry reports improvement in the situation. All residential customers are said to be receiving normal deliveries at this time. Pressures on propane supply will likely continue until the end of the winter season. However, the extent will largely depend on weather conditions and the ability for consumers to conserve. (Source: NRCan; Canadian Propane Association)
Retail Gasoline Overview
The four-week average regular gasoline pump price in selected cities across Canada was $1.27 per litre for the period ending February 18, 2014. This is an increase of 1 cent per litre since the last report on February 7, 2014.
The four-week average crude oil price component of gasoline registered at 66 cents per litre, up by 3 cents per litre from two weeks ago. Compared to the same period in 2013, the crude oil price component of gasoline is nearly 3 cents per litre higher.
Retail gasoline prices in most Western centres increased, on average, by 2 cents per litre when compared to the previous report and ranged from $1.10 per litre to $1.31 per litre. Prices in Eastern cities rose, on average, by 1 cent per litre and ranged from $1.29 per litre to $1.39 per litre.
At the national level, refining and marketing costs and margins declined by 2 cents per litre from the last report. This represents a decrease of 3 cents per litre compared to the same period last year.
Figure 3: Regular Gasoline Pump Prices in Selected Cities
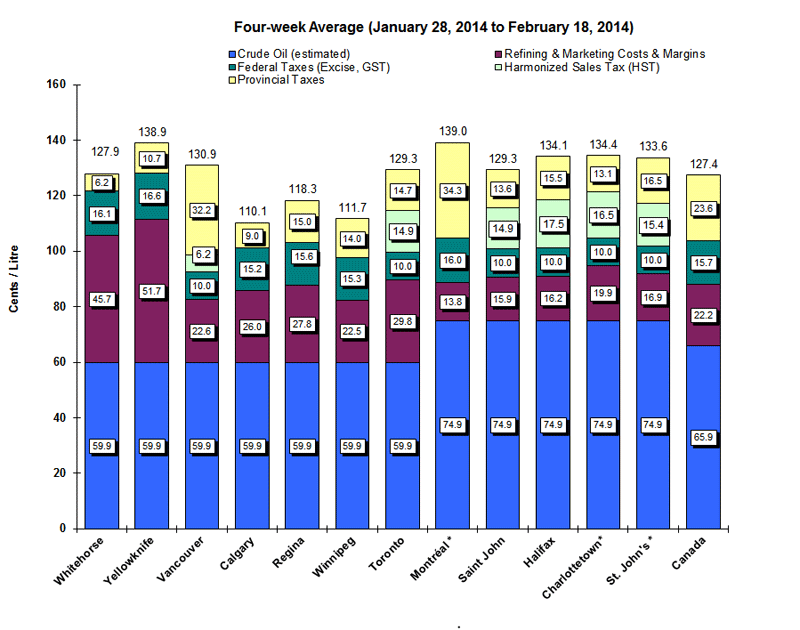
Text version
Figure 3
This graph shows the gasoline price components for 2 territories and 10 cities plus the national average.
| Whitehorse | Yellowknife | Vancouver | Calgary | Regina | Winnipeg | Toronto | Montreal* | Saint John* | Halifax* | Charlottetown* | St. John's* | Canada | |
|---|---|---|---|---|---|---|---|---|---|---|---|---|---|
| Pump Price | 127.9 | 138.9 | 130.9 | 110.1 | 118.3 | 111.7 | 129.3 | 139.0 | 129.3 | 134.1 | 134.4 | 133.6 | 127.4 |
| Crude (est.) | 59.9 | 59.9 | 59.9 | 59.9 | 59.9 | 59.9 | 59.9 | 74.9 | 74.9 | 74.9 | 74.9 | 74.9 | 65.9 |
| Federal Taxes | 16.1 | 16.6 | 10.0 | 15.2 | 15.6 | 15.3 | 10.0 | 16.0 | 10.0 | 10.0 | 10.0 | 10.0 | 15.7 |
| Provincial Tax | 6.2 | 10.7 | 32.2 | 9.0 | 15.0 | 14.0 | 14.7 | 34.3 | 13.6 | 15.5 | 13.1 | 16.5 | 23.6 |
| HST | 6.2 | 14.9 | 14.9 | 17.5 | 16.5 | 15.4 | |||||||
| Refining & Marketing Costs & Margins | 45.7 | 51.7 | 22.6 | 26.0 | 27.8 | 22.5 | 29.8 | 13.8 | 15.9 | 16.2 | 19.9 | 16.9 | 22.2 |
Source: NRCan
* Regulated Markets
Inflation Rose 1.2% in December 2013
According to Statistics Canada’s Consumer Price Index (CPI) report, released January 24, 2014, inflation rose 1.2% in the 12 months to December, following a 0.9% increase in November. The faster year-over-year increase in the CPI was largely attributable to higher gasoline prices, which advanced 4.7% in the 12 months to December, following a 0.4% gain in November. Gasoline prices rose on a monthly basis this December, while they declined in the same month a year ago. Excluding gasoline, consumer prices rose 1.1% on a year-over-year basis in December, after posting a 1.0% increase in November.
The increase in the CPI was led by a rise in the transportation index, followed by higher shelter costs and food prices. Transportation prices advanced 2.1% on a year-over-year basis in December, after rising 0.5% the previous month. In addition to gasoline, prices for the purchase of passenger vehicles rose more in the 12 months to December (+1.4%) than in the 12 months to November (+0.4%).
Source: The Daily, Statistics Canada
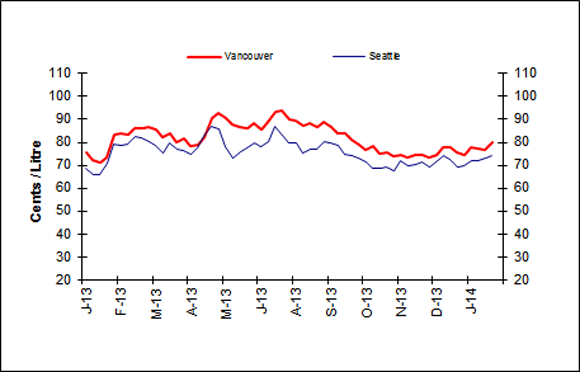
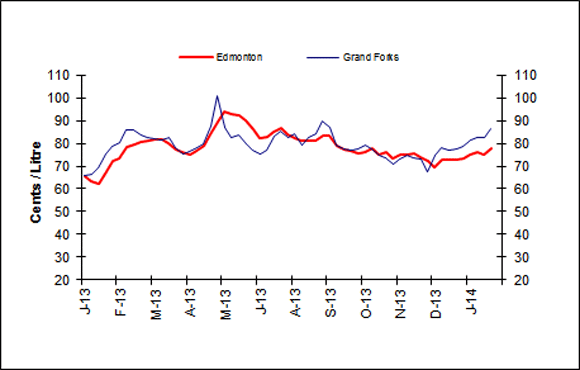
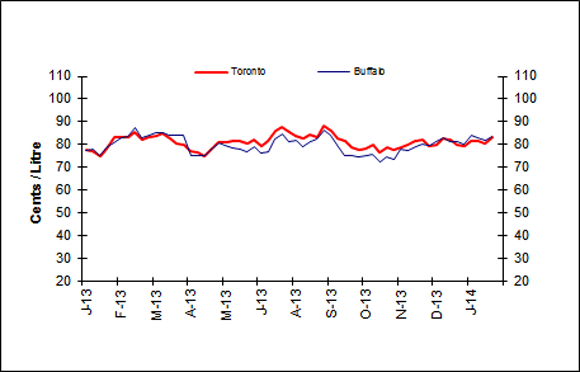
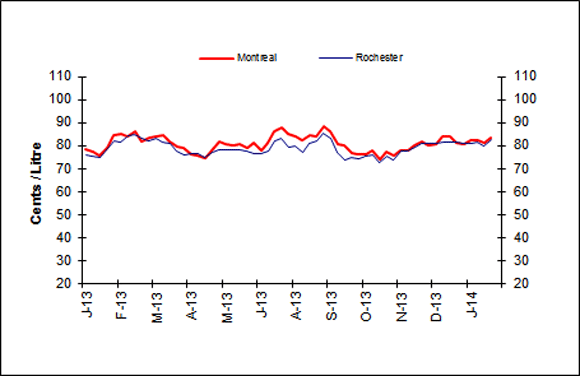
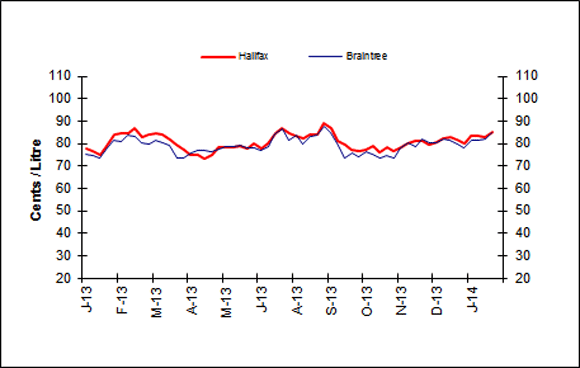
Wholesale Gasoline Prices
For the week ending February 13, 2014, wholesale gasoline prices increased in all Canadian and American centres compared to the previous week.
Wholesale gasoline price changes ranged from an increase of 1 to 4 cents per litre, with prices ending in the 74 to 86 cent-per-litre range.
In the Eastern markets of Canada and the U.S., wholesale gasoline prices, compared to the previous week, registered increases ranging from 2 to 3 cents per litre. Prices for the period ended in the 83 to 85 cent-per-litre range.
Wholesale gasoline prices changes in Western centres ranged between increases of 1 to 4 cents per litre, with prices ending in the range of 74 to 86 cents per litre.
In the last four weeks, wholesale prices in all selected Canadian and American centres have increased in the range of 2 to 8 cents per litre.
 |
 |
|
 |
 |
|
 |
Text version
Figure 4
This graph shows the trend in wholesale gasoline prices for selected centres in Canada and the U.S.
| DATE | Halifax | Braintree | Montreal | Rochester | Toronto | Buffalo | Edmonton | Grand Forks | Vancouver | Seattle |
|---|---|---|---|---|---|---|---|---|---|---|
| Thu 03-Jan-13 | 77.50 | 75.42 | 78.60 | 75.82 | 77.50 | 77.31 | 65.40 | 66.07 | 75.50 | 68.79 |
| Thu 10-Jan-13 | 76.70 | 74.48 | 77.40 | 75.49 | 76.90 | 77.88 | 63.40 | 66.67 | 72.40 | 65.77 |
| Thu 17-Jan-13 | 74.80 | 73.73 | 75.40 | 74.81 | 75.00 | 74.96 | 62.40 | 69.13 | 70.90 | 65.72 |
| Thu 13-Dec-12 | 72.10 | 70.22 | 74.90 | 71.94 | 73.90 | 77.52 | 67.70 | 64.43 | 70.50 | 65.70 |
| Thu 24-Jan-13 | 79.00 | 78.00 | 79.00 | 78.15 | 78.30 | 78.93 | 66.80 | 75.06 | 73.50 | 70.59 |
| Thu 31-Jan-13 | 84.10 | 81.70 | 84.70 | 81.81 | 83.50 | 80.51 | 72.50 | 78.85 | 83.40 | 79.19 |
| Thu 07-Feb-13 | 84.60 | 80.98 | 85.10 | 81.47 | 83.20 | 83.16 | 73.10 | 80.16 | 84.00 | 78.87 |
| Thu 14-Feb-13 | 84.50 | 83.61 | 84.20 | 84.35 | 83.20 | 83.55 | 78.10 | 86.03 | 83.30 | 79.18 |
| Thu 21-Feb-13 | 86.70 | 83.01 | 85.90 | 84.51 | 85.40 | 87.44 | 79.70 | 85.90 | 86.00 | 82.60 |
| Thu 28-Feb-13 | 82.80 | 80.41 | 81.90 | 83.34 | 81.90 | 83.14 | 80.50 | 83.70 | 86.20 | 81.99 |
| Thu 07-Mar-13 | 84.10 | 80.00 | 83.60 | 82.22 | 83.30 | 84.09 | 81.00 | 82.56 | 86.90 | 80.15 |
| Thu 14-Mar-13 | 84.60 | 81.52 | 84.00 | 83.10 | 83.90 | 85.12 | 81.70 | 82.24 | 85.40 | 78.61 |
| Thu 21-Mar-13 | 84.10 | 80.55 | 84.50 | 81.59 | 84.80 | 84.95 | 81.80 | 81.66 | 82.10 | 75.28 |
| Thu 28-Mar-13 | 82.00 | 79.08 | 81.50 | 80.79 | 82.60 | 84.24 | 80.20 | 82.51 | 83.80 | 79.62 |
| Thu 04-Apr-13 | 79.40 | 73.32 | 79.50 | 77.54 | 80.60 | 84.10 | 77.40 | 78.17 | 80.20 | 77.14 |
| Thu 11-Apr-13 | 77.30 | 73.36 | 78.90 | 75.92 | 79.80 | 83.84 | 75.90 | 75.52 | 81.50 | 76.23 |
| Thu 18-Apr-13 | 74.70 | 75.92 | 76.30 | 76.28 | 77.10 | 75.04 | 74.90 | 76.41 | 78.50 | 74.77 |
| Thu 25-Apr-13 | 74.80 | 77.01 | 75.90 | 76.42 | 76.70 | 75.40 | 76.80 | 78.08 | 79.00 | 77.56 |
| Thu 02-May-13 | 73.50 | 76.65 | 74.50 | 75.00 | 75.00 | 75.38 | 78.80 | 79.70 | 82.00 | 83.51 |
| Thu 09-May-13 | 75.10 | 76.22 | 77.60 | 77.03 | 78.50 | 77.88 | 83.90 | 87.57 | 90.80 | 87.15 |
| Thu 16-May-13 | 78.10 | 77.25 | 81.50 | 78.21 | 80.90 | 80.54 | 89.30 | 101.10 | 92.50 | 85.64 |
| Thu 23-May-13 | 78.60 | 78.37 | 80.50 | 78.09 | 81.30 | 79.53 | 94.20 | 86.80 | 90.30 | 78.24 |
| Thu 30-May-13 | 78.40 | 78.36 | 79.80 | 77.90 | 81.40 | 78.43 | 92.60 | 82.64 | 87.60 | 73.33 |
| Thu 06-Jun-13 | 78.70 | 78.91 | 80.50 | 78.17 | 81.60 | 78.16 | 92.40 | 83.64 | 86.60 | 76.00 |
| Thu 13-Jun-13 | 77.80 | 78.32 | 78.90 | 77.45 | 80.60 | 76.84 | 90.20 | 79.79 | 86.00 | 77.78 |
| Thu 20-Jun-13 | 80.10 | 78.00 | 81.00 | 76.50 | 82.00 | 79.30 | 86.20 | 76.78 | 88.10 | 79.78 |
| Thu 27-Jun-13 | 77.80 | 76.96 | 78.10 | 76.22 | 79.40 | 76.41 | 82.40 | 75.29 | 85.70 | 77.93 |
| Thu 04-Jul-13 | 79.80 | 78.53 | 81.30 | 77.56 | 81.80 | 76.93 | 82.70 | 77.19 | 88.70 | 80.47 |
| Thu 11-Jul-13 | 84.60 | 84.52 | 86.30 | 82.08 | 85.80 | 82.51 | 85.00 | 83.36 | 93.40 | 87.07 |
| Thu 18-Jul-13 | 87.10 | 86.48 | 87.80 | 82.88 | 87.80 | 84.45 | 86.70 | 85.15 | 93.90 | 82.94 |
| Thu 25-Jul-15 | 84.40 | 81.63 | 84.80 | 79.09 | 85.40 | 81.21 | 84.10 | 82.55 | 89.90 | 79.53 |
| Thu 01-Aug-13 | 83.20 | 83.68 | 84.00 | 80.06 | 84.10 | 81.93 | 82.00 | 84.32 | 89.50 | 79.81 |
| Thu 08-Aug-13 | 82.30 | 79.58 | 82.20 | 76.89 | 82.60 | 78.85 | 81.10 | 78.95 | 87.00 | 75.45 |
| Thu 15-Aug-13 | 84.20 | 83.01 | 84.40 | 80.94 | 84.20 | 81.32 | 81.20 | 82.30 | 88.50 | 76.76 |
| Thu 22-Aug-13 | 83.90 | 83.75 | 84.00 | 82.03 | 83.50 | 82.16 | 80.90 | 84.32 | 86.40 | 76.73 |
| Thu 29-Aug-13 | 88.90 | 87.42 | 88.30 | 85.55 | 88.10 | 86.41 | 83.40 | 89.62 | 88.90 | 80.31 |
| Thu 05-Sep-13 | 86.70 | 84.77 | 86.20 | 83.13 | 85.90 | 84.03 | 83.20 | 86.81 | 86.50 | 79.97 |
| Thu 12-Sep-13 | 81.00 | 79.52 | 80.90 | 77.16 | 82.90 | 78.97 | 79.20 | 79.37 | 84.00 | 78.65 |
| Thu 19-Sep-13 | 79.70 | 73.77 | 80.20 | 73.60 | 81.60 | 75.45 | 77.10 | 77.32 | 83.70 | 74.59 |
| Thu 26-Sep-13 | 77.40 | 75.99 | 77.00 | 74.69 | 78.70 | 75.25 | 76.50 | 76.96 | 80.90 | 74.43 |
| Thu 03-Oct-13 | 76.50 | 73.93 | 76.00 | 74.33 | 77.80 | 74.45 | 75.60 | 77.48 | 79.10 | 73.09 |
| Thu 10-Oct-13 | 77.00 | 76.23 | 76.40 | 75.22 | 78.20 | 75.24 | 76.20 | 79.28 | 76.80 | 71.32 |
| Thu 17-Oct-13 | 78.80 | 75.48 | 78.00 | 75.66 | 79.80 | 75.64 | 77.80 | 77.39 | 78.30 | 68.82 |
| Thu 24-Oct-13 | 76.30 | 73.26 | 74.20 | 72.60 | 76.40 | 76.40 | 75.10 | 74.67 | 75.20 | 68.55 |
| Thu 31-Oct-13 | 78.40 | 74.83 | 77.40 | 75.50 | 78.90 | 74.66 | 75.90 | 73.89 | 75.50 | 69.29 |
| Thu 07-Nov-13 | 76.50 | 73.29 | 75.40 | 73.47 | 77.70 | 73.62 | 73.10 | 70.87 | 73.90 | 67.58 |
| Thu 14-Nov-13 | 78.50 | 78.01 | 77.70 | 77.49 | 78.90 | 78.23 | 74.80 | 73.14 | 74.60 | 71.77 |
| Thu 21-Nov-13 | 80.00 | 80.43 | 77.80 | 77.74 | 79.80 | 77.16 | 75.30 | 74.96 | 73.50 | 69.75 |
| Thu 28-Nov-13 | 81.30 | 78.79 | 80.20 | 79.06 | 81.60 | 79.32 | 75.50 | 73.46 | 74.60 | 70.20 |
| Thu 05-Dec-13 | 81.30 | 81.98 | 81.70 | 80.77 | 81.90 | 79.95 | 74.00 | 73.04 | 74.70 | 71.18 |
| Thu 12-Dec-13 | 79.30 | 80.57 | 80.00 | 80.76 | 79.60 | 79.52 | 72.30 | 67.30 | 73.60 | 69.01 |
| Thu 19-Dec-13 | 80.60 | 80.41 | 80.60 | 80.76 | 79.80 | 81.20 | 69.40 | 74.95 | 74.60 | 71.49 |
| Thu 26-Dec-13 | 82.50 | 82.08 | 84.20 | 81.35 | 82.80 | 82.75 | 72.70 | 77.90 | 77.80 | 73.92 |
| Thu 02-Jan-14 | 83.00 | 81.60 | 83.90 | 81.26 | 82.40 | 81.49 | 72.90 | 77.05 | 77.80 | 72.33 |
| Thu 09-Jan-14 | 81.80 | 79.89 | 81.30 | 81.25 | 80.00 | 81.12 | 72.60 | 77.50 | 75.40 | 69.37 |
| Thu 16-Jan-14 | 79.90 | 78.10 | 80.80 | 80.69 | 79.20 | 80.27 | 73.60 | 78.54 | 74.50 | 69.50 |
| Thu 23-Jan-14 | 83.30 | 81.27 | 82.50 | 80.86 | 81.50 | 84.27 | 75.20 | 81.56 | 77.80 | 72.04 |
| Thu 30-Jan-14 | 83.60 | 81.57 | 82.50 | 81.27 | 81.60 | 84.27 | 75.90 | 82.75 | 77.20 | 72.24 |
| Thu 06-Feb-14 | 83.00 | 81.77 | 81.00 | 79.85 | 80.60 | 82.00 | 75.00 | 82.38 | 76.40 | 73.02 |
| Thu 13-Feb-14 | 85.40 | 84.58 | 83.50 | 82.68 | 83.50 | 83.54 | 77.70 | 86.24 | 79.80 | 74.26 |
Sources: NRCan, Bloomberg Oil Buyers Guide
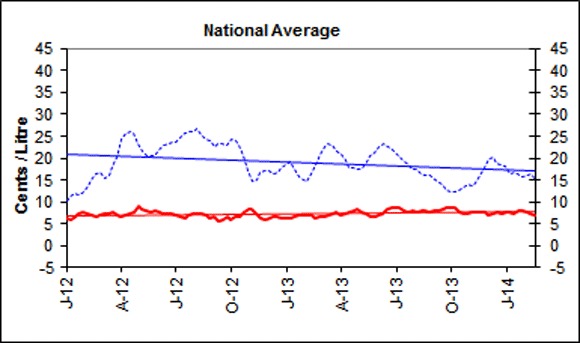
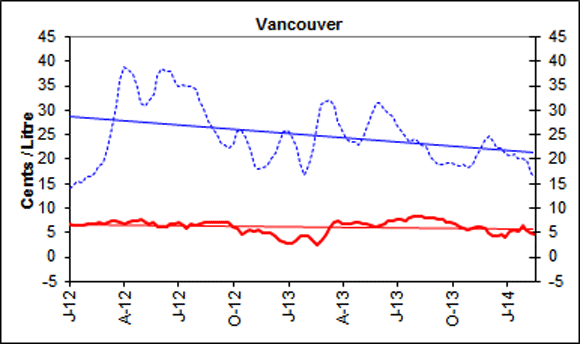
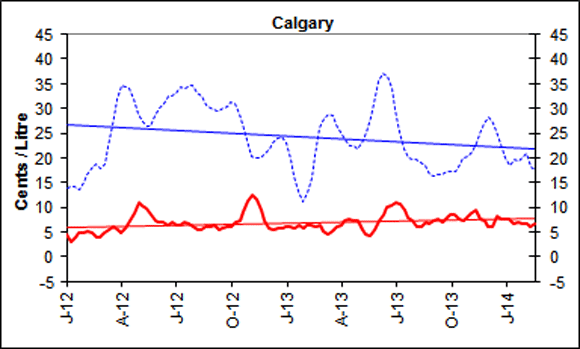
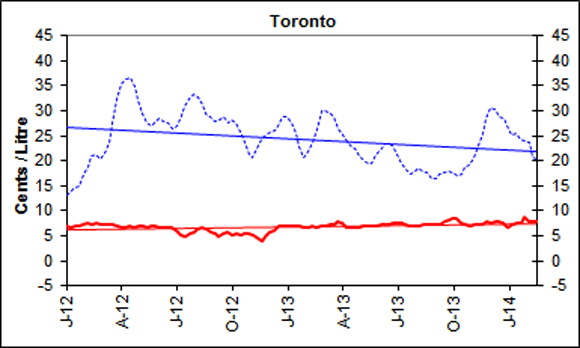
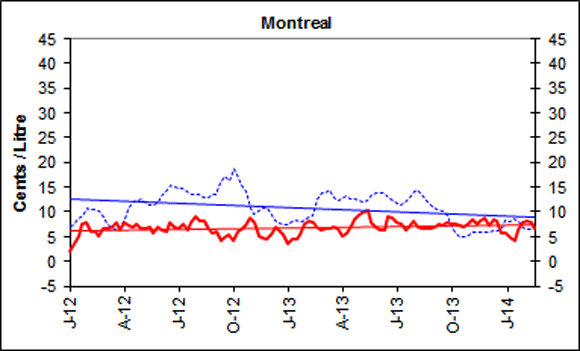
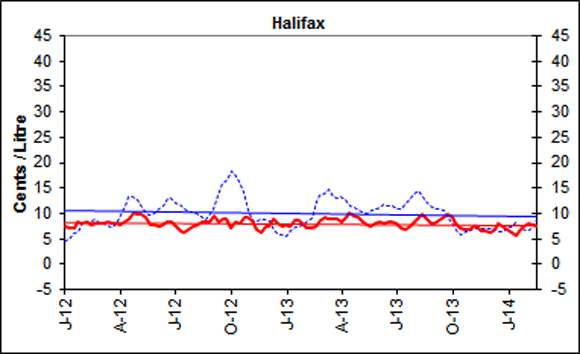
Gasoline Refining and Marketing Margins
Four-week rolling averages are used for gasoline refining and marketing margins.
The relatively low volatility and downward trend in refining margins in the last six weeks reflect an adequate supply of gasoline in North America’s distribution system. Refining margins moved downward, reaching 15 cents per litre for the week ending February 18, 2014. This represents a 3.5 cent–per-litre decrease from last year at the same time.
Overall, marketing margins showed no gains and hovered at around 7 cents per litre. For the five centres, marketing margins ranged from a low of 4.6 cents per litre in Vancouver to a high of 7.9 cents per litre in Toronto.
Marketing margins have to cover the costs associated with operating an outlet and generating a profit for the station owner. These margins can vary significantly depending on the region, volume sold, and availability of other product offerings. Most of the costs of operating an outlet are fixed and do not decline with lower gasoline prices.
 |
 |
|
 |
 |
|
 |
 |
Text version
Figure 5
These graphs show the trend in refining and marketing costs and margins for selected centres in Canada and the national average.
| 4-week rolling average | Canada | Vancouver | Calgary | Toronto | Montreal | Halifax | ||||||
|---|---|---|---|---|---|---|---|---|---|---|---|---|
| Marketing Margin | Refining Margin | Marketing Margin | Refining Margin | Marketing Margin | Refining Margin | Marketing Margin | Refining Margin | Marketing Margin | Refining Margin | Marketing Margin | Refining Margin | |
| 2012-01-03 | 6.1 | 10.4 | 6.9 | 14.1 | 4.6 | 13.9 | 6.9 | 13.0 | 1.9 | 7.1 | 7.3 | 4.4 |
| 2012-01-10 | 6.1 | 11.3 | 6.4 | 14.9 | 3.0 | 14.2 | 6.7 | 13.8 | 3.7 | 7.5 | 7.1 | 5.0 |
| 2012-01-17 | 6.5 | 11.8 | 6.4 | 15.4 | 4.0 | 14.1 | 6.9 | 14.5 | 5.1 | 8.7 | 7.2 | 6.0 |
| 2012-01-24 | 7.3 | 11.5 | 6.3 | 15.1 | 5.0 | 13.6 | 7.0 | 14.9 | 7.5 | 9.1 | 8.3 | 6.5 |
| 2012-01-31 | 7.6 | 12.3 | 6.7 | 16.6 | 5.0 | 15.0 | 7.4 | 17.3 | 8.0 | 10.6 | 8.2 | 8.1 |
| 2012-02-07 | 7.2 | 13.6 | 6.8 | 16.6 | 5.2 | 16.5 | 7.4 | 18.9 | 6.2 | 10.6 | 8.4 | 8.2 |
| 2012-02-14 | 7.0 | 15.2 | 6.8 | 17.4 | 4.8 | 17.9 | 7.3 | 20.8 | 6.1 | 10.3 | 7.8 | 8.4 |
| 2012-02-21 | 6.6 | 16.2 | 6.9 | 18.5 | 3.9 | 18.6 | 7.5 | 21.4 | 5.1 | 10.1 | 7.9 | 8.7 |
| 2012-02-28 | 6.8 | 16.9 | 6.8 | 19.3 | 3.9 | 17.7 | 7.3 | 20.3 | 6.5 | 8.8 | 8.0 | 8.2 |
| 2012-03-06 | 7.1 | 15.4 | 7.2 | 22.2 | 4.9 | 18.9 | 7.3 | 21.6 | 6.7 | 7.7 | 8.1 | 7.9 |
| 2012-03-13 | 7.3 | 16.2 | 7.5 | 26.6 | 5.6 | 22.4 | 7.4 | 23.8 | 6.9 | 6.9 | 8.4 | 7.6 |
| 2012-03-20 | 7.5 | 18.1 | 7.5 | 31.2 | 6.0 | 26.7 | 7.2 | 27.6 | 7.8 | 6.4 | 8.0 | 7.3 |
| 2012-03-27 | 6.9 | 20.1 | 7.1 | 36.2 | 5.6 | 31.9 | 6.9 | 32.5 | 6.3 | 6.9 | 8.0 | 7.7 |
| 2012-04-03 | 6.8 | 24.3 | 6.8 | 39.0 | 4.8 | 34.7 | 6.7 | 35.3 | 7.8 | 8.7 | 7.6 | 9.6 |
| 2012-04-10 | 7.1 | 25.8 | 7.1 | 38.3 | 5.8 | 34.4 | 6.8 | 36.2 | 7.4 | 10.4 | 8.4 | 11.4 |
| 2012-04-17 | 7.5 | 26.2 | 7.5 | 37.4 | 7.2 | 33.9 | 7.0 | 36.6 | 6.9 | 12.1 | 8.8 | 13.1 |
| 2012-04-24 | 8.0 | 25.7 | 7.4 | 34.4 | 9.0 | 31.8 | 6.7 | 34.9 | 7.6 | 12.4 | 10.0 | 13.3 |
| 2012-05-01 | 9.3 | 23.3 | 7.8 | 31.6 | 11.0 | 28.9 | 7.0 | 32.0 | 6.5 | 12.6 | 9.8 | 12.6 |
| 2012-05-08 | 8.7 | 21.7 | 7.2 | 31.0 | 10.5 | 27.3 | 6.9 | 29.5 | 6.6 | 12.0 | 9.8 | 11.3 |
| 2012-05-15 | 8.4 | 20.7 | 6.8 | 32.0 | 9.7 | 26.3 | 6.6 | 27.5 | 6.8 | 11.2 | 9.2 | 10.1 |
| 2012-05-22 | 8.0 | 20.6 | 7.0 | 33.2 | 8.6 | 26.3 | 7.0 | 27.0 | 5.9 | 11.4 | 7.8 | 9.7 |
| 2012-05-29 | 8.1 | 20.5 | 6.2 | 37.0 | 7.4 | 28.4 | 6.8 | 28.0 | 7.0 | 12.0 | 7.8 | 10.1 |
| 2012-06-05 | 8.0 | 21.8 | 6.1 | 38.6 | 7.1 | 30.0 | 6.5 | 28.5 | 6.3 | 13.2 | 7.6 | 10.9 |
| 2012-06-12 | 7.5 | 22.8 | 6.2 | 37.9 | 7.0 | 30.9 | 6.7 | 27.8 | 6.2 | 14.0 | 7.9 | 11.5 |
| 2012-06-19 | 7.8 | 23.3 | 6.7 | 38.0 | 6.3 | 32.5 | 6.7 | 27.5 | 8.0 | 15.3 | 8.3 | 12.9 |
| 2012-06-26 | 7.6 | 23.7 | 6.8 | 35.7 | 6.8 | 32.5 | 6.6 | 26.5 | 6.9 | 15.2 | 8.4 | 12.9 |
| 2012-07-03 | 7.3 | 23.7 | 7.0 | 34.9 | 6.5 | 33.0 | 6.1 | 27.0 | 6.6 | 14.8 | 7.3 | 12.1 |
| 2012-07-10 | 7.0 | 24.5 | 6.6 | 35.3 | 6.3 | 34.4 | 5.3 | 29.0 | 7.4 | 14.7 | 6.4 | 11.8 |
| 2012-07-17 | 6.6 | 25.8 | 5.9 | 34.9 | 7.0 | 34.0 | 4.9 | 30.9 | 6.3 | 14.0 | 6.2 | 10.7 |
| 2012-07-24 | 7.1 | 25.9 | 6.7 | 35.0 | 6.6 | 34.6 | 5.4 | 32.5 | 7.7 | 13.6 | 6.9 | 10.3 |
| 2012-07-31 | 7.6 | 26.1 | 6.6 | 34.3 | 6.2 | 34.6 | 5.8 | 33.3 | 9.0 | 13.4 | 7.5 | 10.4 |
| 2012-08-07 | 7.5 | 26.6 | 6.8 | 32.0 | 5.3 | 33.2 | 6.3 | 32.7 | 8.1 | 13.5 | 7.6 | 9.9 |
| 2012-08-14 | 7.6 | 25.4 | 7.1 | 30.2 | 5.5 | 32.4 | 6.7 | 31.2 | 8.2 | 13.0 | 8.4 | 9.3 |
| 2012-08-21 | 7.2 | 24.5 | 7.1 | 27.9 | 6.1 | 30.7 | 6.3 | 29.3 | 6.9 | 12.8 | 8.4 | 8.8 |
| 2012-08-28 | 6.5 | 23.9 | 7.1 | 26.4 | 6.0 | 30.0 | 5.8 | 28.8 | 5.8 | 13.6 | 8.2 | 9.9 |
| 2012-09-04 | 6.5 | 22.7 | 7.1 | 25.2 | 6.5 | 29.7 | 5.5 | 27.9 | 6.1 | 13.4 | 9.6 | 10.9 |
| 2012-09-11 | 5.6 | 23.3 | 7.0 | 23.6 | 5.3 | 29.3 | 4.8 | 28.3 | 4.2 | 15.9 | 8.4 | 13.5 |
| 2012-09-18 | 6.1 | 23.3 | 7.2 | 22.8 | 5.9 | 30.1 | 5.4 | 28.8 | 4.8 | 17.3 | 9.0 | 15.8 |
| 2012-09-25 | 6.5 | 22.9 | 7.0 | 22.3 | 6.2 | 30.4 | 5.7 | 27.6 | 5.4 | 16.4 | 8.8 | 16.4 |
| 2012-10-02 | 5.9 | 24.2 | 6.3 | 23.3 | 6.0 | 31.2 | 5.3 | 28.3 | 4.3 | 18.7 | 7.0 | 18.5 |
| 2012-10-09 | 6.6 | 23.8 | 5.7 | 25.6 | 6.9 | 31.1 | 5.4 | 27.5 | 6.1 | 17.4 | 8.4 | 17.9 |
| 2012-10-16 | 6.7 | 22.9 | 4.7 | 26.6 | 7.3 | 29.3 | 5.2 | 26.3 | 6.8 | 15.7 | 8.0 | 16.6 |
| 2012-10-23 | 7.5 | 20.4 | 5.1 | 24.4 | 9.1 | 25.9 | 5.5 | 23.7 | 7.2 | 14.0 | 9.3 | 14.3 |
| 2012-10-30 | 8.5 | 17.2 | 5.5 | 21.6 | 11.4 | 22.0 | 5.5 | 20.9 | 8.6 | 10.3 | 9.3 | 10.3 |
| 2012-11-06 | 8.3 | 14.8 | 5.1 | 18.7 | 12.4 | 20.3 | 5.1 | 20.8 | 7.9 | 9.6 | 8.5 | 8.6 |
| 2012-11-13 | 7.3 | 15.1 | 5.4 | 17.2 | 11.5 | 19.3 | 4.6 | 21.7 | 5.2 | 10.4 | 6.7 | 8.7 |
| 2012-11-20 | 6.3 | 16.8 | 5.1 | 18.2 | 9.4 | 20.0 | 4.1 | 24.4 | 4.7 | 10.8 | 6.1 | 8.9 |
| 2012-11-27 | 6.0 | 17.2 | 5.0 | 18.7 | 7.3 | 21.2 | 4.9 | 25.5 | 4.4 | 10.8 | 7.4 | 8.9 |
| 2012-12-04 | 6.2 | 17.2 | 4.8 | 20.1 | 5.8 | 21.8 | 5.8 | 25.7 | 5.5 | 9.9 | 7.5 | 8.6 |
| 2012-12-11 | 6.5 | 16.3 | 4.3 | 19.3 | 5.5 | 21.0 | 6.1 | 24.0 | 6.9 | 7.9 | 9.1 | 6.3 |
| 2012-12-18 | 6.7 | 16.6 | 3.6 | 23.2 | 5.8 | 24.0 | 7.1 | 27.1 | 6.5 | 7.8 | 8.0 | 6.0 |
| 2012-12-25 | 6.4 | 17.7 | 3.0 | 25.6 | 5.8 | 24.4 | 6.8 | 28.8 | 5.4 | 7.5 | 7.4 | 5.8 |
| 2013-01-01 | 6.2 | 18.6 | 2.8 | 25.9 | 6.1 | 23.1 | 7.1 | 28.9 | 3.6 | 7.3 | 7.7 | 5.6 |
| 2013-01-08 | 6.4 | 19.0 | 2.7 | 24.5 | 6.0 | 19.8 | 7.1 | 27.6 | 4.4 | 8.0 | 7.5 | 6.6 |
| 2013-01-15 | 6.5 | 17.5 | 3.5 | 22.2 | 5.9 | 16.3 | 6.8 | 25.5 | 4.6 | 8.2 | 8.5 | 7.2 |
| 2013-01-22 | 6.9 | 15.6 | 4.4 | 20.2 | 6.3 | 14.3 | 7.0 | 23.9 | 5.5 | 8.3 | 8.5 | 7.6 |
| 2013-01-29 | 6.9 | 15.0 | 4.2 | 16.8 | 5.8 | 11.0 | 6.5 | 20.7 | 7.7 | 8.4 | 7.6 | 7.9 |
| 2013-02-05 | 7.0 | 14.6 | 4.2 | 18.2 | 6.4 | 12.3 | 6.8 | 21.1 | 8.1 | 9.5 | 7.1 | 9.2 |
| 2013-02-12 | 6.8 | 16.2 | 3.4 | 22.2 | 6.4 | 16.1 | 6.9 | 23.6 | 7.8 | 9.4 | 7.1 | 9.1 |
| 2013-02-19 | 6.4 | 18.5 | 2.4 | 25.6 | 6.2 | 19.9 | 6.8 | 25.7 | 7.0 | 11.0 | 7.4 | 10.8 |
| 2013-02-26 | 6.6 | 20.8 | 3.4 | 31.1 | 6.3 | 26.0 | 7.0 | 30.0 | 6.3 | 13.7 | 8.6 | 13.6 |
| 2013-03-05 | 6.7 | 22.7 | 4.7 | 32.0 | 5.2 | 27.8 | 7.0 | 30.1 | 6.7 | 13.9 | 9.3 | 14.0 |
| 2013-03-12 | 6.8 | 23.3 | 5.8 | 32.1 | 4.7 | 28.9 | 7.1 | 29.7 | 6.8 | 14.3 | 9.0 | 14.6 |
| 2013-03-19 | 7.2 | 23.1 | 7.0 | 31.5 | 5.1 | 29.1 | 7.4 | 29.4 | 6.8 | 12.3 | 9.1 | 12.8 |
| 2013-03-26 | 7.5 | 21.7 | 7.3 | 27.8 | 6.0 | 26.5 | 7.8 | 26.4 | 6.7 | 12.3 | 9.0 | 12.9 |
| 2013-04-02 | 7.1 | 20.9 | 6.9 | 26.5 | 6.4 | 25.8 | 7.5 | 25.6 | 5.2 | 12.6 | 8.4 | 12.9 |
| 2013-04-09 | 7.3 | 19.4 | 6.8 | 24.2 | 7.4 | 23.6 | 6.8 | 24.1 | 5.7 | 13.2 | 9.2 | 12.6 |
| 2013-04-16 | 7.8 | 17.9 | 6.9 | 22.7 | 7.7 | 21.6 | 6.7 | 22.2 | 7.2 | 11.6 | 10.1 | 10.5 |
| 2013-04-23 | 7.9 | 17.6 | 7.0 | 23.6 | 7.3 | 22.4 | 6.6 | 22.5 | 8.4 | 12.6 | 9.5 | 11.1 |
| 2013-04-30 | 8.2 | 17.6 | 7.2 | 24.1 | 7.4 | 22.9 | 6.8 | 22.2 | 9.5 | 12.2 | 9.2 | 10.6 |
| 2013-05-07 | 7.8 | 17.9 | 6.8 | 24.4 | 5.6 | 23.0 | 6.9 | 20.1 | 9.9 | 12.1 | 8.3 | 10.3 |
| 2013-05-14 | 7.4 | 19.2 | 6.7 | 27.0 | 4.4 | 25.1 | 6.9 | 19.3 | 10.2 | 12.4 | 7.8 | 10.2 |
| 2013-05-21 | 6.6 | 20.7 | 6.3 | 29.2 | 4.1 | 28.2 | 7.0 | 19.6 | 7.7 | 13.4 | 7.6 | 10.7 |
| 2013-05-28 | 6.7 | 21.3 | 6.3 | 31.3 | 5.4 | 32.2 | 7.0 | 20.8 | 6.9 | 13.8 | 8.1 | 10.9 |
| 2013-06-04 | 7.0 | 22.6 | 6.6 | 31.4 | 7.2 | 35.6 | 7.2 | 22.0 | 6.3 | 13.7 | 8.4 | 11.2 |
| 2013-06-11 | 7.3 | 23.3 | 6.8 | 29.9 | 8.5 | 36.8 | 7.2 | 22.9 | 6.4 | 13.9 | 8.1 | 11.8 |
| 2013-06-04 | 7.0 | 22.6 | 6.6 | 31.4 | 7.2 | 35.6 | 7.2 | 22.0 | 6.3 | 13.7 | 8.4 | 11.2 |
| 2013-06-11 | 7.3 | 23.3 | 6.8 | 29.9 | 8.5 | 36.8 | 7.2 | 22.9 | 6.4 | 13.9 | 8.1 | 11.8 |
| 2013-06-18 | 8.5 | 22.7 | 7.5 | 29.4 | 9.9 | 36.5 | 7.4 | 23.5 | 9.0 | 13.0 | 8.2 | 11.5 |
| 2013-06-25 | 8.7 | 22.2 | 7.5 | 29.0 | 10.4 | 34.3 | 7.6 | 23.4 | 8.8 | 12.4 | 8.3 | 11.5 |
| 2013-07-02 | 8.8 | 21.4 | 7.8 | 27.3 | 10.9 | 29.8 | 7.7 | 21.4 | 7.7 | 11.7 | 8.1 | 11.0 |
| 2013-07-09 | 8.6 | 21.3 | 7.6 | 27.5 | 10.8 | 26.9 | 7.5 | 21.2 | 7.5 | 12.1 | 7.2 | 11.7 |
| 2013-07-16 | 7.9 | 19.3 | 7.3 | 24.9 | 9.3 | 21.9 | 7.2 | 18.2 | 6.3 | 12.1 | 6.9 | 11.9 |
| 2013-07-23 | 7.8 | 18.3 | 8.0 | 23.9 | 8.0 | 20.3 | 7.0 | 17.8 | 7.0 | 12.7 | 7.4 | 12.5 |
| 2013-07-30 | 7.9 | 17.5 | 8.2 | 24.0 | 7.4 | 19.6 | 7.1 | 18.0 | 8.0 | 14.0 | 8.0 | 13.8 |
| 2013-08-06 | 7.6 | 17.4 | 8.2 | 23.6 | 6.2 | 19.4 | 6.9 | 18.2 | 7.1 | 14.5 | 9.0 | 14.4 |
| 2013-08-13 | 7.8 | 16.4 | 8.4 | 22.8 | 6.2 | 18.9 | 7.2 | 17.9 | 6.8 | 13.4 | 9.7 | 13.2 |
| 2013-08-20 | 7.9 | 16.1 | 8.0 | 23.0 | 6.9 | 18.6 | 7.3 | 17.8 | 6.6 | 12.7 | 8.8 | 12.7 |
| 2013-08-27 | 7.8 | 16.2 | 8.0 | 20.5 | 6.8 | 16.7 | 7.4 | 16.4 | 6.6 | 11.3 | 8.0 | 11.5 |
| 2013-09-03 | 7.9 | 15.2 | 8.1 | 19.5 | 7.2 | 16.4 | 7.3 | 16.5 | 6.9 | 11.4 | 8.1 | 11.7 |
| 2013-09-10 | 8.0 | 14.6 | 7.8 | 18.9 | 7.6 | 16.7 | 7.3 | 17.3 | 7.5 | 10.4 | 8.8 | 10.8 |
| 2013-09-17 | 8.2 | 14.0 | 7.6 | 17.7 | 7.1 | 15.6 | 7.9 | 16.7 | 7.2 | 9.1 | 9.1 | 9.4 |
| 2013-09-24 | 8.6 | 12.7 | 7.2 | 19.3 | 7.8 | 17.1 | 8.1 | 18.0 | 7.8 | 9.1 | 9.7 | 9.4 |
| 2013-10-01 | 8.8 | 12.1 | 7.0 | 18.4 | 8.4 | 16.3 | 8.6 | 16.8 | 7.4 | 7.3 | 9.2 | 7.9 |
| 2013-10-08 | 8.5 | 12.2 | 6.7 | 18.9 | 8.5 | 17.2 | 8.4 | 17.1 | 7.4 | 5.9 | 8.1 | 6.6 |
| 2013-10-15 | 7.8 | 12.5 | 6.2 | 18.2 | 7.5 | 17.8 | 7.6 | 17.2 | 7.3 | 5.1 | 7.0 | 6.1 |
| 2013-10-22 | 7.3 | 13.2 | 5.9 | 18.8 | 7.3 | 20.0 | 7.4 | 18.8 | 6.9 | 5.1 | 6.8 | 6.3 |
| 2013-10-29 | 7.3 | 13.9 | 5.7 | 18.1 | 7.8 | 20.1 | 6.9 | 19.1 | 7.6 | 5.1 | 6.7 | 6.3 |
| 2013-11-05 | 7.8 | 13.6 | 5.9 | 18.8 | 8.9 | 21.3 | 7.2 | 20.8 | 8.4 | 5.7 | 7.3 | 6.9 |
| 2013-11-12 | 7.8 | 14.5 | 6.0 | 18.5 | 9.5 | 21.2 | 7.4 | 21.2 | 7.6 | 6.0 | 7.4 | 7.0 |
| 2013-11-19 | 7.6 | 16.2 | 6.1 | 21.9 | 7.7 | 24.7 | 7.3 | 25.6 | 8.3 | 5.9 | 6.6 | 7.0 |
| 2013-11-26 | 7.6 | 17.8 | 5.8 | 23.7 | 7.2 | 26.9 | 7.9 | 28.3 | 8.8 | 6.8 | 6.6 | 7.8 |
| 2013-12-03 | 7.0 | 19.9 | 4.9 | 24.8 | 6.1 | 28.1 | 7.7 | 30.5 | 7.3 | 5.9 | 6.1 | 6.9 |
| 2013-12-10 | 7.3 | 20.2 | 4.5 | 24.3 | 6.1 | 27.8 | 7.9 | 30.9 | 8.3 | 6.2 | 6.9 | 7.0 |
| 2013-12-17 | 7.8 | 18.9 | 4.3 | 22.2 | 8.2 | 24.6 | 7.8 | 28.9 | 8.0 | 6.1 | 8.0 | 6.4 |
| 2013-12-24 | 7.2 | 18.4 | 4.7 | 22.3 | 7.6 | 22.9 | 7.7 | 28.5 | 5.6 | 6.8 | 7.6 | 6.5 |
| 2013-12-31 | 7.5 | 18.1 | 5.7 | 23.0 | 8.1 | 22.0 | 8.1 | 28.3 | 6.3 | 8.0 | 7.6 | 7.1 |
| 2014-01-07 | 7.7 | 16.4 | 5.2 | 20.8 | 7.6 | 18.6 | 7.4 | 25.3 | 4.7 | 8.1 | 6.3 | 7.4 |
| 2014-01-14 | 7.3 | 16.7 | 5.5 | 21.2 | 6.8 | 19.7 | 7.6 | 25.6 | 4.1 | 8.7 | 5.8 | 8.1 |
| 2014-01-21 | 7.9 | 16.3 | 5.2 | 20.1 | 7.0 | 19.4 | 7.6 | 24.3 | 6.4 | 8.1 | 6.6 | 7.7 |
| 2014-01-28 | 7.9 | 15.6 | 6.6 | 20.1 | 6.7 | 20.1 | 8.7 | 24.1 | 7.8 | 6.9 | 7.4 | 6.7 |
| 2014-02-04 | 7.6 | 16.1 | 5.5 | 20.0 | 6.7 | 21.3 | 8.0 | 24.2 | 8.2 | 6.5 | 8.1 | 6.7 |
| 2014-02-11 | 7.3 | 16.4 | 5.0 | 16.9 | 6.1 | 18.0 | 8.0 | 20.7 | 7.8 | 6.5 | 7.6 | 7.3 |
| 2014-02-18 | 7.0 | 15.0 | 4.6 | 16.4 | 6.7 | 17.7 | 7.9 | 20.3 | 6.6 | 7.2 | 7.6 | 8.7 |
Source: NRCan
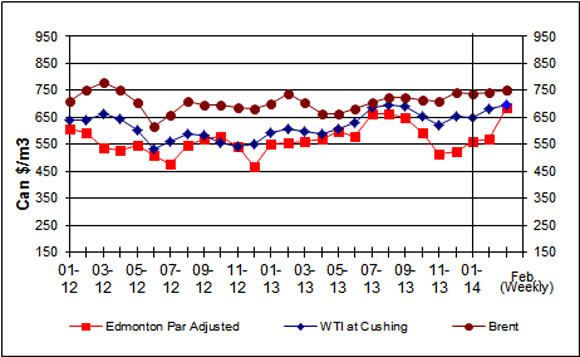
Crude Oil Overview
Significant Rebound for Edmonton Par Crude Oil Prices
For the week ending February 14, 2014, prices for the three marker crudes averaged between $685/m3 and $753/m3 (US$99 to US$109 per barrel). This is an increase of $8 to $115/m3 (US$2 to US$17 per barrel) from the previous week.
Edmonton Par crude oil prices rebounded for the week ending February 14, 2014, mainly due the draw on U.S. crude oil inventories. U.S. commercial crude oil inventories dropped 8% between November 22, 2013, and February 7, 2014, due to an increase demand from the cold weather.
In addition, the southern leg of the Keystone XL pipeline opened on January 22, 2014, providing opportunities to ship more crude oil, including Canadian crudes, away from the U.S. Midwest to other U.S. markets. The gap between Edmonton Par and WTI closed at $8/m3 (US$1.18 per barrel) – the lowest average weekly differential since July 26, 2013.
The Organization of Petroleum Exporting Countries revised its world oil demand growth forecast for 2014, which is expected to grow faster from 1 million barrels per day in 2013 to 1.1 million barrels per day in 2014. Most of the growth is expected to come from OECD countries, North America and Europe.
Figure 6: Crude Oil Price Comparisons
Text version
Figure 6
This graph shows crude oil prices for Edmonton Par, WTI and Brent. The average weekly prices for the period ending February 14, 2014, were $685/cubic metres, $693/cubic metres and $753/cubic metres for Edmonton Par, WTI and Brent, respectively.
| Date | Edmonton Par Prices | WTI Prices | Brent Prices |
| 01/12 | 608.11 | 639.88 | 709.45 |
| 02/12 | 594.50 | 640.89 | 750.59 |
| 03/12 | 538.60 | 663.34 | 780.71 |
| 04/12 | 528.21 | 644.60 | 751.91 |
| 05/12 | 548.81 | 601.64 | 704.10 |
| 06/12 | 507.78 | 532.76 | 618.43 |
| 07/12 | 477.07 | 560.69 | 659.07 |
| 08/12 | 544.82 | 587.49 | 707.75 |
| 09/12 | 570.15 | 582.08 | 697.56 |
| 10/12 | 578.61 | 555.66 | 694.60 |
| 11/12 | 539.87 | 543.52 | 686.30 |
| 12/12 | 467.14 | 549.56 | 680.33 |
| 01/13 | 549.97 | 592.14 | 699.83 |
| 02/13 | 553.76 | 605.29 | 736.06 |
| 03/13 | 560.66 | 598.93 | 705.36 |
| 04/13 | 571.20 | 590.06 | 663.78 |
| 05/13 | 598.81 | 608.31 | 662.59 |
| 06/13 | 577.25 | 630.51 | 680.52 |
| 07/13 | 664.03 | 685.36 | 703.73 |
| 08/13 | 665.21 | 697.44 | 722.47 |
| 09/13 | 647.06 | 691.84 | 723.16 |
| 10/13 | 592.41 | 655.54 | 713.92 |
| 11/13 | 511.65 | 620.13 | 711.21 |
| 12/13 | 524.69 | 655.42 | 740.65 |
| 01/14 | 561.87 | 651.27 | 735.43 |
| February 7, 2014 | 570.24 | 680.16 | 744.33 |
| February 14, 2014 | 685.24 | 693.40 | 752.74 |
Sources: NRCan
| Crude Oil Types | Week Ending: 2014-02-14 |
Change From: Previous Week | Change From: Last Year | |||
|---|---|---|---|---|---|---|
| $Can/ m3 |
$US/ bbl |
$Can/ m3 |
$US/ bbl |
$Can/ m3 |
$US/ bbl |
|
| Edmonton Par | 685.24 | 98.99 | +115.00 | +17.04 | +132.93 | +11.52 |
| WTI | 693.40 | 100.17 | +13.24 | +2.42 | +80.88 | +3.16 |
| Brent | 752.74 | 108.74 | +8.41 | +1.77 | +7.24 | -9.33 |
Source: NRCan
U.S. Short-Term Energy Outlook
According to the U.S. Energy Information Administration (EIA), temperatures east of the Rocky Mountains have been significantly colder this winter (October - January) compared to the same period both last winter and the previous 10-year average, putting upward pressure on consumption and prices of fuels used for space heating. U.S. average heating degree days were 12% higher than last winter (indicating colder weather) and 8% above the previous 10-year average. The Northeast was 11% colder than last winter, the Midwest 17% colder, and the South 20% colder, while the West was 3% warmer.
The cold weather has had the greatest effect on propane prices, particularly for consumers in the Midwest. Cold temperatures have tightened supplies in the East and Midwest regions that were already low heading into the winter heating season.
While the North Sea Brent crude oil monthly average spot price fell by almost $3 per barrel from December to January, cold temperatures have tightened heating oil supplies and helped drive up retail prices.
Cold weather also contributed to a new record-high withdrawal of natural gas from storage and a surge in natural gas spot prices.
Source: U.S. EIA, Short-Term Energy Outlook
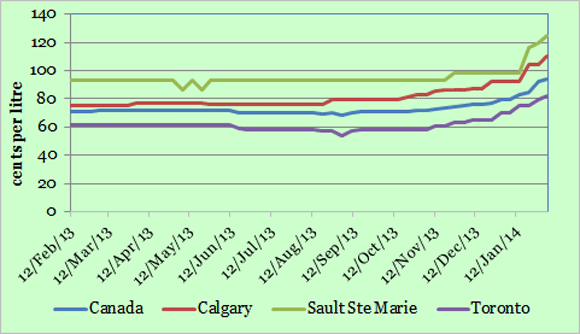
Supplement
Propane Supply and Distribution Situation in Eastern Ontario and Western Quebec
Propane is a by-product of natural gas processing and petroleum refining. In Canada, propane is primarily produced at natural gas processing plants. According to the National Energy Board (NEB), approximately 84 percent of Canadian propane was produced from natural gas wells in 2012, while the remaining 16 percent was produced at refineries or during bitumen upgrading. The majority of propane is produced in natural gas-producing areas in Alberta and B.C. In 2012, Canada produced approximately 30,525 m3 per day (m3/d) of propane. Of this, more than 15,739 m3/d was exported to the U.S., while Canada imported approximately 700 m3/d.
The Canadian/U.S. propane market is highly integrated. Canada is a net exporter of propane. Propane inventories in Canada are built up prior to the winter heating season, and are based on forecast levels of demand.
In 2013, demand for propane to dry agricultural crops increased the demand for propane above normal levels. Farmers use propane as a fuel to dry out corn crops and a productive wet summer resulted in higher demand for propane in the U.S. Midwest and other agricultural regions. This was followed by extremely cold weather in the winter of 2013 and 2014.
Some regions of eastern Ontario and western Québec reported localized propane shortages during the months of December 2013 and early January 2014. According to the NEB propane inventories in eastern Canada were drawn down by 26 percent compared to the same period last year. Distribution issues were causing localized shortages of propane as regional propane distribution networks worked to refill local inventories. Extreme temperatures and inclement weather delayed deliveries of propane to regional storage hubs, and higher than normal demand exceeded local propane trucking networks’ ability to service customers in December and early January.
Natural Resources Canada’s Fuel Focus report publishes propane p rices for automotive use on its website. On average, consumers have seen prices for automobile propane increase from about 73 cents per litre in early November 2013 to $1.05 per litre in February 2014. As indicated in the graph below, some centres experienced much higher prices.
The Minister of Natural Resources and Industry Canada have recently asked the NEB and the Competition Bureau to look at propane market issues, including price increases, scarcity and the volume of exports to the U.S. and to report on the issue by the end of April 2014.
Average Retail Prices for Auto Propane ( Last 52 Weeks )
Text version
Figure 7
This graph shows the average retail prices, including taxes, for Auto Propane for the last 52 weeks, from February 12, 2013 to February 4, 2014.
| Date | Canada | Calgary | Sault Ste Marie | Toronto |
|---|---|---|---|---|
| 12/02/2013 | 71.2 | 75.2 | 92.9 | 61.9 |
| 19/02/2013 | 71.3 | 75.2 | 92.9 | 61.9 |
| 26/02/2013 | 71.3 | 75.2 | 92.9 | 61.9 |
| 05/03/2013 | 71.4 | 75.2 | 92.9 | 61.9 |
| 12/03/2013 | 71.4 | 75.2 | 92.9 | 61.9 |
| 19/03/2013 | 71.4 | 75.2 | 92.9 | 61.9 |
| 26/03/2013 | 71.4 | 75.2 | 92.9 | 61.9 |
| 02/04/2013 | 71.7 | 77.2 | 92.9 | 61.9 |
| 09/04/2013 | 71.7 | 77.2 | 92.9 | 61.9 |
| 16/04/2013 | 71.7 | 77.2 | 92.9 | 61.9 |
| 23/04/2013 | 71.7 | 77.2 | 92.9 | 61.9 |
| 30/04/2013 | 71.7 | 77.2 | 92.9 | 61.9 |
| 07/05/2013 | 71.7 | 77.2 | 85.9 | 61.9 |
| 14/05/2013 | 71.9 | 77.2 | 92.9 | 61.9 |
| 21/05/2013 | 72 | 77.2 | 85.9 | 61.9 |
| 28/05/2013 | 71.7 | 75.9 | 92.9 | 61.9 |
| 04/06/2013 | 71.9 | 75.9 | 92.9 | 61.9 |
| 11/06/2013 | 71.9 | 75.9 | 92.9 | 61.9 |
| 18/06/2013 | 70.5 | 75.9 | 92.9 | 58.9 |
| 25/06/2013 | 70 | 75.9 | 92.9 | 57.9 |
| 02/07/2013 | 69.9 | 75.9 | 92.9 | 57.9 |
| 09/07/2013 | 70 | 75.9 | 92.9 | 57.9 |
| 16/07/2013 | 70 | 75.9 | 92.9 | 57.9 |
| 24/07/2013 | 70 | 75.9 | 92.9 | 57.9 |
| 31/07/2013 | 70 | 75.9 | 92.9 | 57.9 |
| 06/08/2013 | 70 | 75.9 | 92.9 | 57.9 |
| 13/08/2013 | 70 | 75.9 | 92.9 | 57.9 |
| 20/08/2013 | 69.5 | 75.9 | 92.9 | 56.9 |
| 27/08/2013 | 70.1 | 79.2 | 92.9 | 56.9 |
| 03/09/2013 | 68.7 | 79.2 | 92.9 | 53.9 |
| 10/09/2013 | 70.2 | 79.9 | 92.9 | 56.9 |
| 17/09/2013 | 70.9 | 79.9 | 92.9 | 58.4 |
| 24/09/2013 | 70.9 | 79.9 | 92.9 | 58.4 |
| 01/10/2013 | 70.9 | 79.9 | 92.9 | 58.4 |
| 08/10/2013 | 70.9 | 79.9 | 92.9 | 58.4 |
| 15/10/2013 | 70.9 | 79.9 | 92.9 | 58.4 |
| 22/10/2013 | 71.1 | 81.2 | 92.9 | 58.4 |
| 29/10/2013 | 71.4 | 83.2 | 92.9 | 58.4 |
| 05/11/2013 | 71.4 | 83.2 | 92.9 | 58.4 |
| 12/11/2013 | 72.9 | 85.2 | 92.9 | 60.7 |
| 19/11/2013 | 73.1 | 86.6 | 92.9 | 60.7 |
| 26/11/2013 | 74.2 | 86.6 | 97.9 | 63.2 |
| 03/12/2013 | 74.9 | 86.6 | 97.9 | 63.2 |
| 10/12/2013 | 75.9 | 87.2 | 97.9 | 64.9 |
| 17/12/2013 | 76.4 | 87.2 | 97.9 | 64.9 |
| 24/12/2013 | 77.3 | 92.6 | 97.9 | 64.9 |
| 31/12/2013 | 79.9 | 92.6 | 97.9 | 69.9 |
| 07/01/2014 | 79.9 | 92.6 | 97.9 | 69.9 |
| 14/01/2014 | 82.7 | 92.6 | 97.9 | 74.8 |
| 21/01/2014 | 84.9 | 103.9 | 115.9 | 74.9 |
| 28/01/2014 | 92 | 103.9 | 119.4 | 79.9 |
| 04/02/2014 | 93.9 | 110.6 | 124.4 | 82.4 |
Download the report
Fuel Focus - Printable Version [PDF, 537 KB]
To read Adobe Acrobat® files, you will need to download and install the free Acrobat Reader® software available from Adobe Systems Incorporated.
Page details
- Date modified: