
Assessing the Promise of Integrated Community Energy Solutions
PDF Version [PDF - 1.9MB] | Next Page
Canadian communities account for an estimated 60 percent of national energy consumption. Since 1901, the proportion of Canadians who live in urban areas has grown from 38 percent to 80 percent, and by 2020, this figure could reach 85 percent. Meanwhile, the population is expected to grow to about 43 million by 2050, further increasing the impact on the environment. In this context, Integrated Community Energy Solutions offer great opportunities for improving the energy performance of communities, while enhancing quality of life and Canada’s economic competitiveness.
Canadians live in more than 5400 communities. While the communities vary greatly in size and location, they all need energy for transportation, heating, cooling and lighting, as well as to power local industry and commerce.
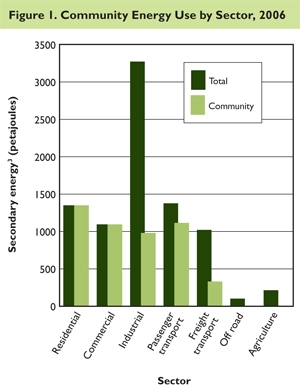
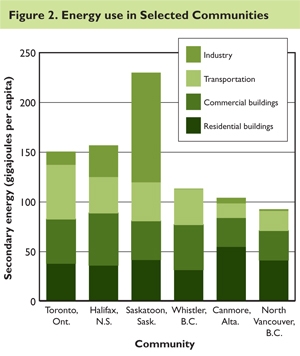
It is estimated that communities accounted for about 60 percent of Canada’s 2006 energy consumption (see Figure 1Footnote 1) with a relatively equal breakdown among four key sectors: residential buildings, commercial buildings, industry and passenger transportation. The energy profiles of Canadian communities vary significantly on a per capita basis, as illustrated in Figure 2. Energy use from homes and buildings is generally consistent across communities, but there is significant variation in use by transportation and industry.Footnote 2
text version - figure 1
Figure 1
This is a vertical bar graph depicting energy use in Canada by sector, and includes both the total energy use and the energy used within communities. The horizontal axis represents the sectors and the vertical axis represents the secondary energy use, in petajoules.
Residential: Total 1350 PJ, Community 1350 PJ.
Commercial: Total 1090 PJ, Community 1090 PJ.
Industrial: Total 3270 PJ, Community 977 PJ.
Passenger transport: Total 1370 PJ, Community 1110 PJ.
Freight transport: Total 1020 PJ, Community 328 PJ.
Off road: Total 99 PJ, Community 0 PJ.
Agriculture: Total 211 PJ, Community 0 PJ.
text version - figure 2
Figure 2
This is a vertical bar graph depicting energy use in selected communities. The horizontal axis represents the cities and the vertical axis represents the secondary energy use, in gigajoules per capita. The bar for each city is divided into energy used in each sector.
Toronto, Ontario: Residential buildings 39 GJ, Commercial buildings 44 GJ, Transportation 55 GJ, Industry 13 GJ, Total 151 GJ
Halifax, Nova Scotia: Residential buildings 37 GJ, Commercial buildings 52 GJ, Transportation 37 GJ, Industry 31 GJ, Total 157 GJ
Saskatoon, Saskatchewan.: Residential buildings 42 GJ, Commercial buildings 39 GJ, Transportation 39 GJ, Industry 110 GJ, Total 230 GJ
Whistler, British Columbia: Residential buildings 32 GJ, Commercial buildings 45 GJ, Transportation 36 GJ, Industry 0 GJ, Total 113 GJ
Canmore, Alberta: Residential buildings 55 GJ, Commercial buildings 29 GJ, Transportation 15 GJ, Industry 5 GJ, Total 104 GJ
North Vancouver, British Columbia: Residential buildings 42 GJ, Commercial buildings 29 GJ, Transportation 20 GJ, Industry 1 GJ, Total 92 GJ
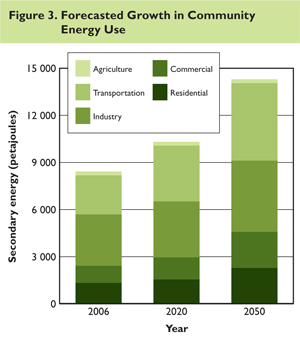
As illustrated in Figure 3,Footnote 4 under a business-as-usual scenario, community energy use could be expected to increase by about 75 percent by 2050, compared with 2006. This change would lead to a large increase in greenhouse gas (GHG) emissions, therefore increasing the challenge of meeting GHG reduction targets.
text version - figure 3
Figure 3
This is a vertical bar graph depicting the forecasted growth in community energy use. The horizontal axis represents the year and the vertical axis represents the secondary energy use, in petajoules. The bar for each year is divided into energy used in each sector.
In 2006, energy use in communities totalled 8,400 petajoules. Of this total, 1,300 petajoules was in the residential sector, 1,100 petajoules was in the commercial sector, 3,300 petajoules was in the industry sector, 2,500 petajoules was in the transportation sector and 200 petajoules was in the agricultural sector.
Forecasted energy use in communities in 2020 is 10,300 petajoules. Of this total, 1,600 petajoules is in the residential sector, 1,400 petajoules is in the commercial sector, 3,600 petajoules is in the industry sector, 3,600 petajoules is in the transportation sector and 200 petajoules is in the agricultural sector.
Forecasted energy use in communities in 2050 is 14,300 petajoules. Of this total, 2,300 petajoules is in the residential sector, 2,300 petajoules is in the commercial sector, 4,500 petajoules is in the industry sector, 5,000 petajoules is in the transportation sector and 200 petajoules is in the agricultural sector.
Integrated Community Energy Solutions (ICES) have been identified as offering some significant opportunities to reduce GHG emissions. However, there is a shortage of studies that have attempted to quantify the full potential associated with their solutions. To address this gap, a collaborative called Quality Urban Energy Systems of Tomorrow (QUEST) commissioned a study that applied the National Round Table on the Environment and the Economy’s modelling approach in the Getting to 2050 studyFootnote 5 to assess the potential of ICES for meeting climate change targets. The results, while preliminary, suggest that the potential energy savings and GHG emissions reduction of ICES are promising and “that stringent land-use policy to encourage densification, including constraints on the geographic footprint of cities, specification of densification corridors with fast and reliable transit, and reform of the property tax system to reflect marginal infrastructure building and maintenance costs, has the capacity to reduce direct and indirect urban emissions by approximately 40 to 50 percent in the long run.”Footnote 6
The QUEST analysis was supported by a literature review to assess the potential for ICES in Canada. Highlighted were three Canadian studies that have estimated the potential community-level GHG reductions from aspects of ICES to be approximately 43 percent,Footnote 7 47 percentFootnote 8 and 50 percentFootnote 9 of total community-level emissions. Findings from these studies and others included in the literature review also suggested that emissions reductions could be further augmented by taking advantage of waste, water and waste heat as energy sources.
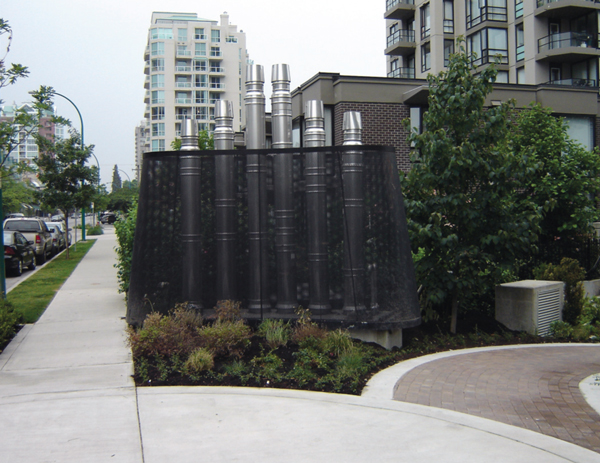
District energy mini-plants, housed in select buildings, are added as the system grows. (Lonsdale Energy Corporation, North Vancouver, British Columbia)
Community-level studies support these findings. For example, the City of North Vancouver, British Columbia, completed its 100 Year Sustainability Vision in 2008. This initiative explored the feasibility of reducing the community’s GHG emissions by 80 percent from 2007 levels by 2050 and eliminating them by 2107. This was a public, stakeholder-driven process that integrated building, transportation, infrastructure and technology options. A key finding was that close to one third of the targeted per capita reductions could be achieved through community form decisions alone. The study found that full realization could be achievable with complementary policies, technology investments, and greater collaboration among regional, provincial and federal governments.
The results of these studies point to a very significant potential. While work continues to better quantify and realize this potential, the message is clear: ICES could form an integral part of Canada's high-performance energy future and its GHG emissions reduction strategies.
Page details
- Date modified: