
Visual Interpretation
The simplest classification method is performed by visual interpretation. An interpreter learns how surface features are portrayed in the image, and his/her mind fills in missing details based upon local knowledge and experience.
To aid visual interpretation, the multiple channels of polarimetric data can be used to present the data in a colour image, in which certain image features are recognizable by a trained interpreter. As a simple example, a colour image can be made using an HH=red, HV=green and VV=blue channel assignment (see Figure 6-3). This tends to "look realistic" as water reflections have a higher VV component than HH, and vegetation has a higher than average HV backscatter.
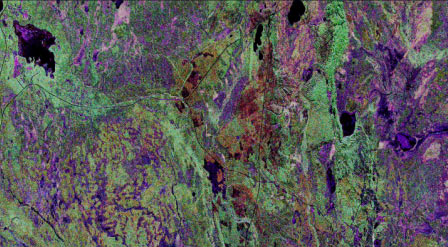
Figure 6-3: SIR-C L-band colour composite image of Nipawin Provincial Park, north of Prince Albert, Saskatchewan (HH - red, HV - green and VV - blue)
As an example of the interpretation that can be obtained from such an image, the following description is from the NASA web site: http://visibleearth.nasa.gov/. Search: Space Radar Image of Prince Albert, Canada
This is a false-color composite of Prince Albert, Canada, centered at 53.91 north latitude and 104.69 west longitude. This image was acquired by the Spaceborne Imaging Radar C/X-Band Synthetic Aperture Radar (SIR-C/X-SAR) aboard space shuttle Endeavor on its 20th orbit. The area is located 40 kilometers (25 miles) north and 30 kilometers (20 miles) east of the town of Prince Albert in the Saskatchewan province of Canada. The image covers the area east of the Candle Lake, between gravel surface highways 120 and 106 and west of 106. The area in the middle of the image covers the entire Nipawin (Narrow Hills) provincial park. The look angle of the radar is 30 degrees and the size of the image is approximately 20 kilometers by 50 kilometers.
The image was produced by using only the L-band. The three polarization channels HH, HV and VV are illustrated by red, green and blue respectively. The changes in the intensity of each color are related to various surface conditions such as variations in forest stands, frozen or thawed condition of the surface, disturbances (fire and deforestation), and areas of regrowth. Most of the dark areas in the image are the ice-covered lakes in the region. The dark area on the top left corner of the image is the White Gull Lake north of the intersection of highway 120 and 913. The right middle part of the image shows Lake Ispuchaw and Lower Fishing Lake. The deforested areas are also shown by dark areas in the image. Since most of the logging practice at the Prince Albert area is around the major highways, the deforested areas can be easily detected as small geometrically shaped dark regions along the roads.
At the time of the SIR-C/X-SAR overpass a major part of the forest is either frozen or undergoing the spring thaw. The L-band HH shows a high return in the jack pine forest. The reddish areas in the image are old jack pine forest, 12 to 17 meters in height and 60 to 75 years old. The orange-greenish areas are young jack pine trees, 3 to 5 meters (10 to 16 feet) in height and 11 to 16 years old. The green areas are due to the relative high intensity of the HV channel, which is strongly correlated with the amount of biomass. The L-band HV channel shows the biomass variations over the entire region. Most of the green areas, when compared to the forest cover maps are identified as black spruce trees. The dark blue and dark purple colors show recently harvested or regrowth areas respectively.
Page details
- Date modified: