
Natural Resources Canada Quarterly Financial Report (Unaudited) for the Quarter Ended December 31, 2017
Statement outlining results, risks and significant changes in operations, personnel and programs
1. Introduction
This quarterly financial report should be read in conjunction with the Main Estimates, Supplementary Estimates (A) and Supplementary Estimates (B), as well as Canada’s Budget 2017. It has been prepared by management as required by section 65.1 of the Financial Administration Act and in the form and manner prescribed by Treasury Board. This quarterly financial report has not been subject to an external audit or review.
1.1 Authority, Mandate and Programs
Natural Resources Canada (NRCan) works to improve the quality of life of Canadians by ensuring that our natural resources are developed sustainably, providing a source of jobs, prosperity, and opportunity, while preserving our environment and respecting our communities and Indigenous peoples.
Further details on NRCan’s authority, mandate and programs can be found in Part II of the Main Estimates.
1.2 Basis of Presentation
This quarterly financial report has been prepared by management using an expenditure basis of accounting. The accompanying Statement of Authorities includes NRCan’s spending authorities granted by Parliament, and those used by NRCan are consistent with the Main Estimates, Supplementary Estimates (A) and Supplementary Estimates (B) for the 2017-2018 fiscal year. This quarterly report has been prepared using a special purpose financial reporting framework designed to meet financial information needs with respect to the use of spending authorities.
The authority of Parliament is required before money can be spent by the Government. Approvals are given in the form of annually approved limits through appropriation acts, or through legislation in the form of statutory spending authority for specific purposes.
NRCan uses the full accrual method of accounting to prepare and present its annual unaudited departmental financial statements that are part of the departmental results reporting process. However, the spending authorities voted by Parliament remain on an expenditure basis.
2. Highlights of Fiscal Quarter and Fiscal Year-to-Date Results
This Departmental Quarterly Financial Report reflects the results as at December 31, 2017, including Main Estimates, Supplementary Estimates (A) and Supplementary Estimates (B) for which full supply was released. The details presented in this report focus on and compare the third quarter results of 2017-2018 with those of 2016-2017.
Authorities
As per Table 1, presented at the end of this document, and on Graph 1 below, as at December 31, 2017, NRCan has authorities available for use of $1,451.5 million in 2017-2018 compared to $1,743.3 million as of December 31, 2016, for a net decrease of $291.8 million or 17%. This decrease is mainly due to a forecasted reduction in offshore statutory payments as a result of fluctuations in oil and natural gas prices, and decreased production.
Graph 1
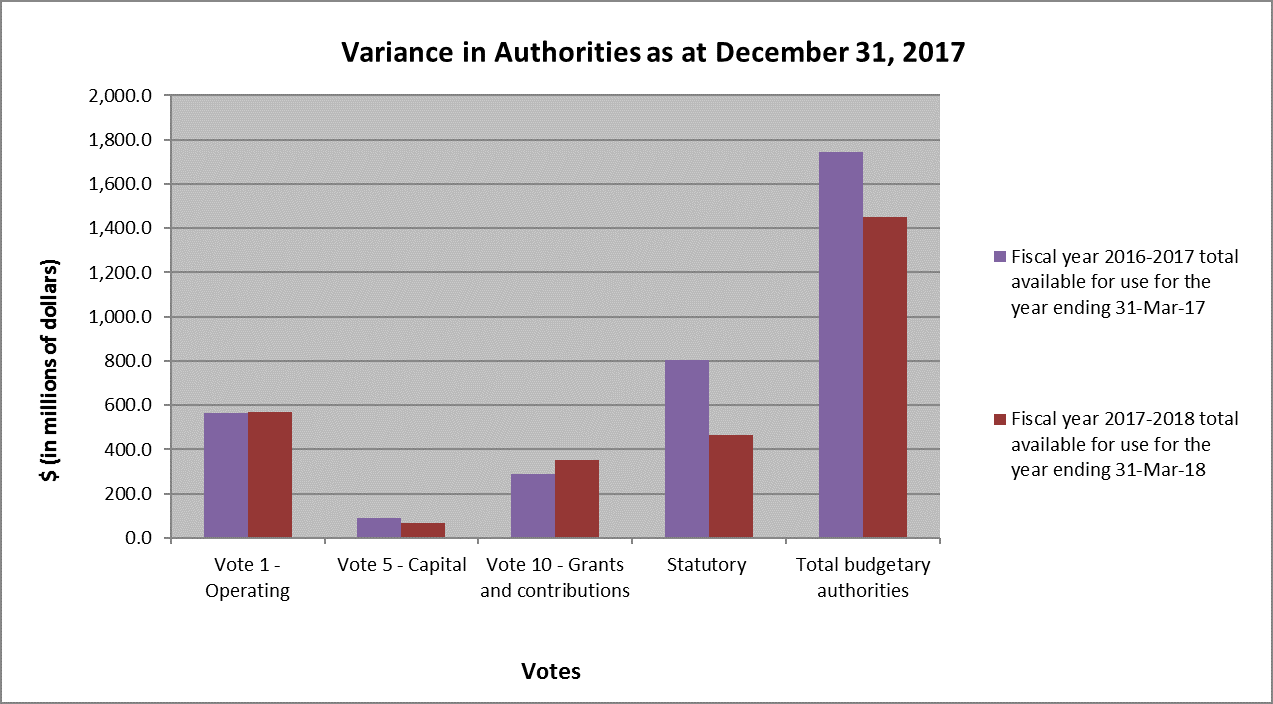
Text version
| (in millions of dollars) | Fiscal year 2016-2017 total available for use for the year ending 31-Mar-17 |
Fiscal year 2017-2018 total available for use for the year ending 31-Mar-18 |
|---|---|---|
| Vote 1 - Operating | 564.7 | 567.6 |
| Vote 5 - Capital | 87.7 | 69.2 |
| Vote 10 - Grants and contributions | 287.6 | 351.1 |
| Statutory | 803.2 | 463.6 |
| Total budgetary authorities | 1,743.3 | 1,451.5 |
The decrease of $291.8 million in authorities in 2017-2018 compared to 2016-2017 is explained by the net effect of both increases and decreases within Vote 1 operating expenditures, Vote 5 capital expenditures, Vote 10 grants and contributions, and statutory authorities, as per the following:
For Vote 1 operating expenditures, a net increase of $2.9 million between the authorities available for use at the end of the third quarters of 2017-2018 ($567.6 million) and 2016-2017 ($564.7 million) is explained mainly by the following year-over-year changes:
Increases:
- $27.4 million for collective bargaining to cover wage increases in 2017-2018 and retroactive payments for 2014-2015, 2015-2016 and 2016-2017;
- $7.5 million for the Clean Growth and Climate Change programs, due to a planned adjustment to the program financial profileFootnote 1;
- $6.2 million for the transfers from Capital to Operating, as part of a planned decrease in capital spending; and,
- $3.2 million for the implementation of the Indigenous Advisory and Monitoring Committees for Energy Infrastructure Projects, a new initiative in 2017-2018.
Decreases:
- $23.8 million for the United Nations Convention on the Law of the Sea – Mapping of the North Pole, due to a planned adjustment to the program financial profile1;
- $13.1 million for the Soldier Settlement Board, due to a planned adjustment to the program financial profile1; and,
- $4.8 million for the professional services reduction announced in Budget 2016.
For Vote 5 capital expenditures, a net decrease of $18.5 million between the authorities available for use at the end of the third quarters of 2017-2018 ($69.2 million) and 2016-2017 ($87.7 million) is explained mainly by the following year-over-year changes:
Decreases:
- $14.7 million for the Federal Infrastructure Initiative (FII), due to a planned adjustment to the program financial profile1;
- $6.2 million for the transfers from Capital to Operating, as part of a planned decrease in capital spending; and,
- $6.1 million for the Enhancing National Earthquake Monitoring initiative, due to a planned adjustment to the program financial profile1.
Increase:
- $7.7 million for the Capital Budget Carry Forward as there were more authorities available to carry forward in 2017-2018.
For Vote 10 grants and contributions, a net increase of $63.5 million between the authorities available for use at the end of the third quarters of 2017-2018 ($351.1 million) and 2016-2017 ($287.6 million) is explained mainly by the following year-over-year changes:
Increases:
- $66.8 million for the Clean Growth and Climate Change programs, due to a planned adjustment to the program financial profile1;
- $34.5 million for the Green Infrastructure envelope (i.e., Electric Vehicle Demonstrations), due to a planned adjustment to the program financial profile1;
- $10.8 million for the Softwood Lumber Action Plan envelope (i.e., Investments in Forest Industry Transformation), as this envelope received new incremental funding starting in 2017-2018;
- $7.5 million for the implementation of the Indigenous Advisory and Monitoring Committees for Energy Infrastructure Projects, a new initiative in 2017-2018; and,
- $5.9 million for the Youth Employment Strategy, as this program received additional funding in Budget 2017.
Decreases:
- $25.1 million for the sunsetting of the ecoENERGY for Biofuels program in 2016-2017;
- $18.4 million for the ecoENERGY for Renewable Power program, due to a planned adjustment to the program financial profile1; and,
- $17.3 million for the Sustainable Development Technology Canada (SDTC) Sustainable Development Technology Fund, due to the transfer of responsibility for SDTC to the Department of Innovation, Science and Economic Development in 2016-2017.
For statutory items, a net decrease of $339.6 million between the third quarters of 2017-2018 ($463.6 million) and 2016-2017 ($803.2 million) is explained mainly by:
Decreases:
- $325.9 million in the Newfoundland Offshore Petroleum Resource Revenue Fund, as forecasts at the time of Main Estimates were that less revenue would be collected in 2017-2018 than in 2016-2017, due to fluctuations in oil prices and variances in productionFootnote 2;
- $8.2 million in the Nova Scotia Offshore Revenue Account, as forecasts at the time of Main Estimates were that less revenue would be collected in 2017-2018 than in 2016-2017 due to fluctuations in natural gas prices and variances in production2; and
- $5.3 million in Employee Benefit Plan adjustment, as the rate decreased in 2017-2018 compared to 2016-2017.
In addition to the above detail, other minor increases and decreases occurred within the appropriated funding and in other statutory departmental programs.
Budgetary Expenditures by Standard Object
The spending for the quarter ending December 31, 2017 amounts to $240.9 million or 17% of total funding available for the fiscal year, compared to $286.2 million or 16% for the same quarter last year. This decrease of $45.3 million in spending is mainly related to a decrease in expenditures for transfer payments in 2017-2018 compared to the same type of expenditures in 2016-2017. Further analysis has been done on standard objects with significant expenses, which is represented on Graph 2 below, and Table 2 at the end of this document presents the spending for all standard objects.
Graph 2
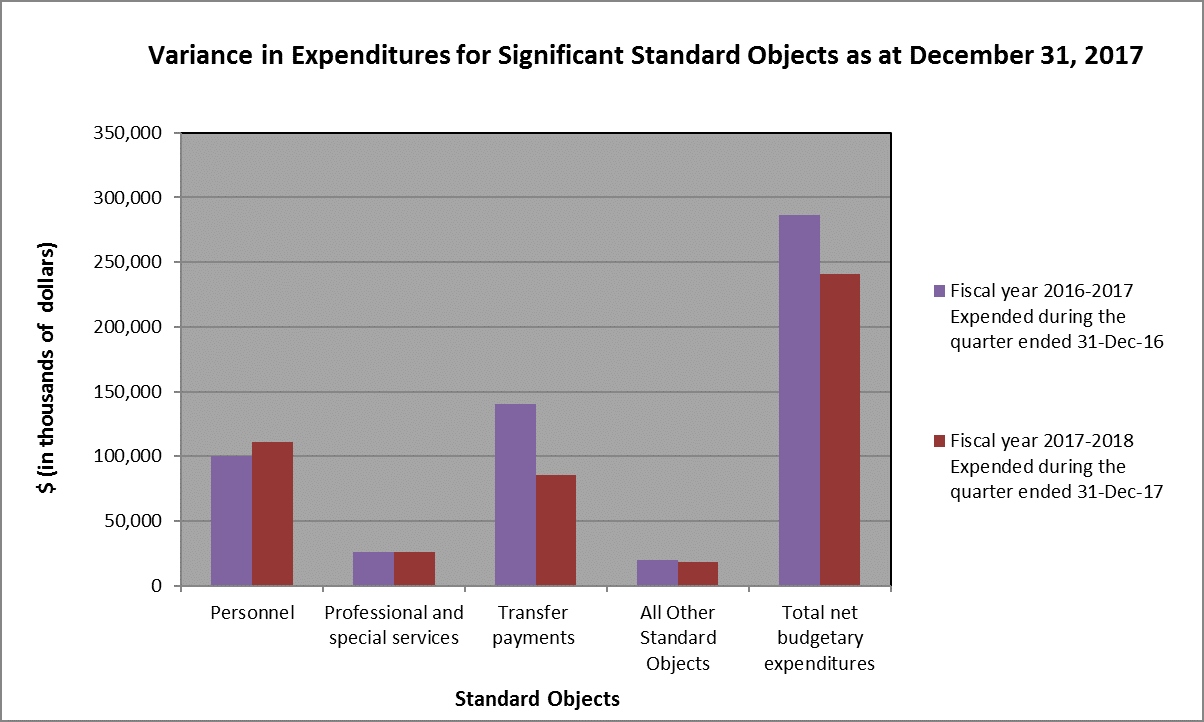
Text version
| (in thousands of dollars) | Fiscal year 2016-2017 Expended during the quarter ended 31-Dec-16 |
Fiscal year 2017-2018 Expended during the quarter ended 31-Dec-17 |
|---|---|---|
| Personnel | 100,373 | 110,880 |
| Professional and special services | 25,906 | 25,851 |
| Transfer payments | 140,080 | 85,648 |
| All Other Standard Objects | 19,854 | 18,504 |
| Total net budgetary expenditures | 286,213 | 240,883 |
The net increase of $10.5 million in personnel expenditures between the third quarters of 2017-2018 ($110.9 million) and 2016-2017 ($100.4 million) is mainly due to retroactive payments and wage increases arising from collective bargaining settlements ($7.4 million) as well as an increase of pay transfers to be recovered ($2.4 million) from other departments.
The net increase of $37.4 million in personnel expenditures between the year-to-date expenditures at the end of the third quarters of 2017-2018 ($341.3 million) and 2016-2017 ($303.9 million) is largely due to retroactive payments and wage increases arising from collective bargaining settlements ($28.2 million) as well as an increase of pay transfers to be recovered ($8.0 million) from other departments.
For the professional and special services expenditures, there are no significant variances between the third quarters of 2017-2018 and 2016-2017.
The net decrease of $7.9 million in professional and special services expenditures between the year-to-date expenditures at the end of the third quarters of 2017-2018 ($63.3 million) and 2016-2017 ($71.2 million) is mainly due to:
Decreases:
- $9.6 million for the FII due to a coding change to accurately reflect the way these program expenditures are being recorded. For most of 2016-2017, they were recorded under professional and special services while they were recorded under acquisition of land, buildings and works in 2017-2018. The adjustment to record these expenditures against acquisition of land, buildings and works was done in the fourth quarter of 2016-2017; and
- $2.2 million due to the timing of expenditures from one year to the next for real property payments.
Increase:
- $3.3 million due to increased spending related to various projects and priorities.
The net decrease of $5.2 million in repair and maintenance expenditures between the third quarters of 2017-2018 ($2.3 million) and 2016-2017 ($7.5 million) and the net decrease of $7.9 million between the year-to-date expenditures at the end of the third quarters are mainly due to the sunsetting of one component of FII in 2016-2017 as well as the timing of some repair payments.
The net increase of $6.1 million in acquisition of land, buildings and works expenditures between the third quarters of 2017-2018 ($6.2 million) and 2016-2017 ($0.1 million) and the net increase of $15.2 million between the year-to-date expenditures at the end of the third quarters are mainly due to a coding change to accurately reflect the way FII expenditures are being recorded (see comment under professional and special services section). In addition, there was also an increase in spending of one component of FII in 2017-2018.
The net decrease of $3.0 million in acquisition of machinery and equipment expenditures between the third quarters of 2017-2018 ($3.1 million) and 2016-2017 ($6.1 million) and the net decrease of $5.8 million between the year-to-date expenditures at the end of the third quarters are due to non-recurring machinery purchases in 2016-2017.
The net decrease of $54.4 million in expenditures for transfer payments between the third quarters of 2017-2018 ($85.6 million) and 2016-2017 ($140.0 million) primarily consists of:
Decreases:
- $57.4 million for statutory Atlantic offshore transfers as a result of lower offshore oil production; and
- $12.2 million in reduced expenditures for the ecoENERGY for Renewable Power program due to a planned adjustment to the program financial profile1.
Increases:
- $7.3 million in increased expenditures for Clean Growth and Climate Change programs (i.e., Oil & Gas and Energy Innovation Program) due to a planned adjustment to the program financial profile1;
- $3.3 million for Investments in Forest Industry Transformation due to increased claims received in the third quarter of 2017-2018; and
- $2.7 million in increased expenditures for Electric Vehicle Demonstrations due to a planned adjustment to the program financial profile1.
The net decrease of $112.4 million in expenditures for transfer payments between the year-to-date expenditures at the end of the third quarters of 2017-2018 ($268.2 million) and 2016-2017 ($380.6 million) is mainly related to the same reasons as above as well as a one-time statutory royalty payment related to the White Rose project and the payments to SDTC made in 2016-2017.
The net decrease of $12.4 million in other subsidies and payments between the year-to-date expenditures at the end of third quarters of 2017-2018 ($10.6 million) and 2016-2017 ($23.0 million) is mainly due to a payment to the Government of Manitoba for the Soldier Settlement Board, which occurred in 2016-2017.
In addition to the above details, other minor increases and decreases were observed within different standard objects.
3. Risks and Uncertainties
NRCan recognizes that a solid understanding of its risk environment is fundamental to achieving its strategic outcomes and maintaining operational efficiency and effectiveness. The Department has identified its key risks and has developed mitigation strategies that are presented in the Departmental Plan and the Departmental Results Report.
The natural resource sectors are at the nexus of Canada’s economic and environmental agendas. They bring large economic benefits, accounting for about 16% of Canada’s nominal gross domestic product and 1.7 million jobs in 2016. Furthermore, they contribute to Canada’s environmental performance for sustainable development. Our collective challenge, which is also an opportunity, is to set and implement a plan that will ensure the growth of the resource sectors in the transition to a low carbon economy.
During the first three quarters of 2017-2018, the Department focused on managing its risks to advance priorities in the areas of softwood lumber; regulatory review, including modernization of the National Energy Board; Canada-United States relations; clean technology; Indigenous reconciliation; and Budget 2017 implementation, including funding for actions to support the Pan-Canadian Framework on Clean Growth and Climate Change. The Department is also aware of the emerging competitiveness issues faced by the natural resource sectors.
NRCan manages uncertainties regarding its future funding level and spending. The Department continues to manage the costs related to unfunded collective bargaining. In response, it tracks its financial risks through scenario planning, monthly analysis of trends and forecasting in both salary and non-salary expenditures, and comprehensive quarterly reviews.
NRCan will continue to integrate risk information into strategic and operational decision-making.
4. Significant Changes in Relation to Operations, Personnel, Programs
The appointment of a new Assistant Deputy Minister for the Lands and Minerals Sector occurred in the third quarter of 2017-2018.
No other significant changes in relation to operations, personnel or programs occurred during the third quarter of 2017-2018.
Original signed by:
___________________________________________
Christyne Tremblay
Deputy Minister
February 26, 2018
Ottawa, Canada
___________________________________________
Cheri Crosby, CPA
Chief Financial Officer
February 16, 2018
Ottawa, Canada
| (in thousands of dollars) | Fiscal year 2017-2018 | Fiscal year 2016-2017 | ||||
|---|---|---|---|---|---|---|
| Total available for use for the year ending March 31, 2018* | Used during the quarter ended December 31, 2017 | Used year-to-date at quarter-end | Total available for use for the year ending March 31, 2017** | Used during the quarter ended December 31, 2016 | Used year-to-date at quarter-end | |
| Vote 1 - Net Operating Expenditures | 567,592 | 127,380 | 392,677 | 564,744 | 111,400 | 364,227 |
| Vote 5 - Capital Expenditures | 69,182 | 13,503 | 25,633 | 87,738 | 19,072 | 35,337 |
| Vote 10 - Grants and Contributions | 351,135 | 49,659 | 116,346 | 287,564 | 47,893 | 128,062 |
| Statutory Payments | ||||||
| Minister of Natural Resources – Salary and motor car allowance | 84 | 22 | 64 | 84 | 30 | 49 |
| Contributions to employee benefit plans | 54,514 | 13,350 | 40,051 | 59,826 | 13,325 | 39,973 |
| Spending of amounts equivalent to proceeds from disposal of surplus crown assets | - | 56 | 56 | - | 105 | 106 |
| Canada Foundation for Sustainable Development Technology Grant | - | - | - | - | - | 2,290 |
| Contribution to the Canada/ Newfoundland Offshore Petroleum Board | 8,835 | (2,257) | 2,161 | 8,835 | (55) | 4,363 |
| Contribution to the Canada/Nova Scotia Offshore Petroleum Board | 4,355 | (44) | 1,045 | 4,013 | (184) | 1,994 |
| Payments to the Nova Scotia Offshore Revenue Account | 6,624 | 2,241 | 5,802 | 14,828 | 5,416 | 8,360 |
| Payments to the Newfoundland Offshore Petroleum Resource Revenue Fund | 387,367 | 36,973 | 143,778 | 713,253 | 89,211 | 236,267 |
| Crown Share Adjustment Payments for Nova Scotia Offshore Petroleum Resources | 1,818 | - | 53 | 2,408 | - | 1,607 |
| Total Statutory Payments | 463,597 | 50,341 | 193,010 | 803,247 | 107,848 | 295,009 |
| Total Budgetary Authorities | 1,451,506 | 240,883 | 727,666 | 1,743,293 | 286,213 | 822,635 |
* Total available for use includes only authorities available for use and granted by Parliament at quarter-end through the Main Estimates, Supplementary Estimates (A), Supplementary Estimates (B) and some measures announced in Budget 2017.
** Total available for use includes only authorities available for use and granted by Parliament at quarter-end through the Main Estimates, Supplementary Estimates (A), Supplementary Estimates (B) and some measures announced in Budget 2016.
| (in thousands of dollars) | Fiscal year 2017-2018 | Fiscal year 2016-2017 | ||||
|---|---|---|---|---|---|---|
| Planned expenditures for the year ending March 31, 2018* | Expended during the quarter ended December 31, 2017 | Year-to-date used at Quarter-end | Planned expenditures for the year ending March 31, 2017** | Expended during the quarter ended December 31, 2016 | Year-to-date used at Quarter-end | |
| Budgetary Expenditures: | ||||||
| Personnel | 429,227 | 110,880 | 341,297 | 403,872 | 100,373 | 303,944 |
| Transportation and communication | 14,515 | 4,059 | 11,151 | 14,675 | 3,009 | 9,792 |
| Information | 5,524 | 1,303 | 3,274 | 9,349 | 975 | 2,781 |
| Professional and special services | 132,435 | 25,851 | 63,291 | 142,952 | 25,906 | 71,212 |
| Rentals | 33,315 | (546) | 10,739 | 33,170 | 1,591 | 15,251 |
| Repair and maintenance | 5,432 | 2,274 | 4,235 | 4,157 | 7,527 | 12,059 |
| Utilities, materials and supplies | 37,517 | 3,804 | 10,036 | 34,084 | 4,100 | 11,104 |
| Acquisition of land, buildings and works | 2,121 | 6,222 | 15,328 | 38,068 | 155 | 155 |
| Acquisition of machinery and equipment | 67,091 | 3,136 | 5,862 | 51,681 | 6,177 | 11,630 |
| Transfer payments | 760,133 | 85,648 | 268,261 | 1,030,901 | 140,080 | 380,641 |
| Other subsidies and payments | 2,661 | 3,019 | 10,670 | 19,254 | 4,294 | 23,042 |
| Total Budgetary Expenditures | 1,489,971 | 245,650 | 744,144 | 1,782,163 | 294,187 | 841,611 |
| Less: | ||||||
| Total Revenues Netted Against Expenditures | 38,465 | 4,767 | 16,478 | 38,870 | 7,974 | 18,976 |
| Total Net Budgetary Expenditures | 1,451,506 | 240,883 | 727,666 | 1,743,293 | 286,213 | 822,635 |
* Planned expenditures reflect some measures announced in Budget 2017.
** Planned expenditures reflect some measures announced in Budget 2016.
Page details
- Date modified: